
Figures & data
Figure 1. Vertical and horizontal integration.
Source: own research.
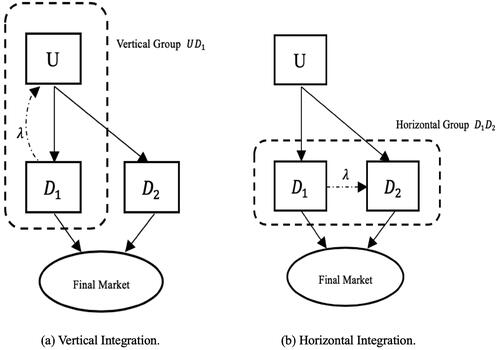
Table 1. PBEs of benchmark and integration case without control.
Figure 2. Profits of integrated firms without control.
Source: own research.
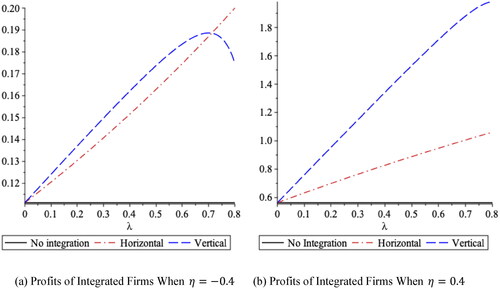
Table 2. PBEs of benchmark and integration case with control.
Figure 3. Profits of integrated firms with control.
Source: own research.
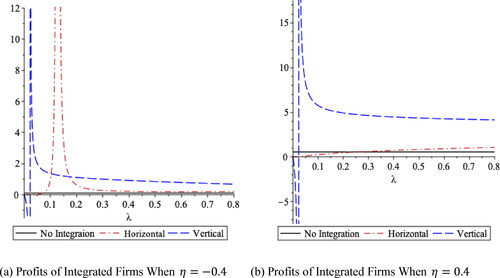
Figure 4. Profits of integrated firms in consistent circumstance between ownership and control.
Source: own research.
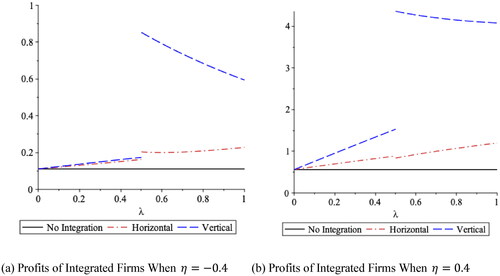
Figure 5. Impacts of market environment without control.
Source: own research.
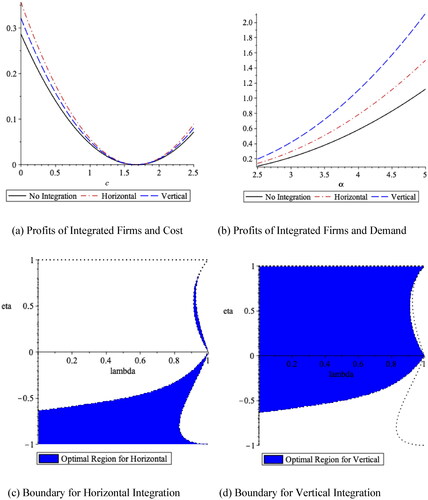
Figure 6. Impacts of market environment with control.
Source: own research.
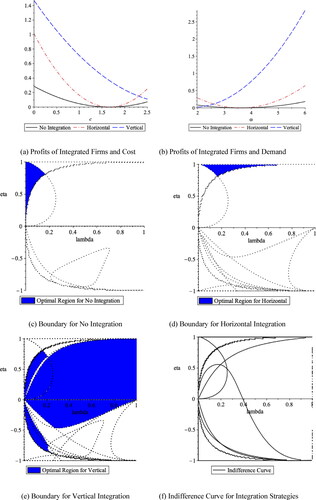
Figure 7. Profits of vertical and horizontal integrated firms.
Source: own research.
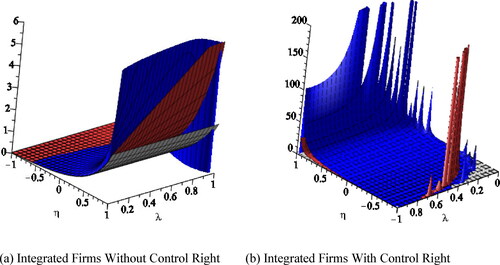
Figure 8. Profits of integrated firms and market structure.
Source: own research.
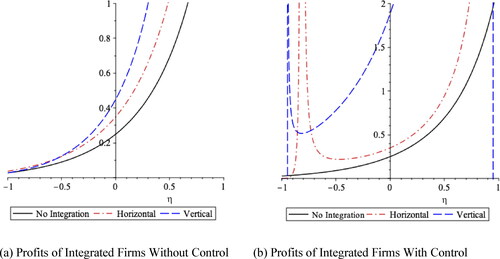
Figure 9. Profits of integrated firms in case of independent market.
Source: own research.
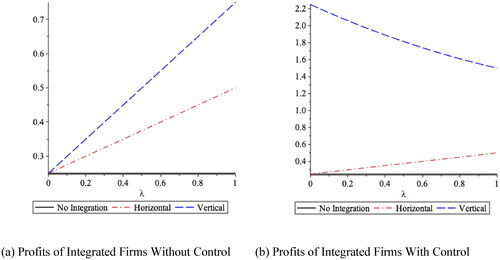
Table 3. Regression results of firm’s short-term (long-term) performance.
Table 4. Robustness check for different levels of control-ownership disparity.
Table 5. Robustness check based on DID approach.