
Figures & data
Figure 1. Left panel: real GDP in million EUR (r_gdp) and real spending on social protection benefits (r_spb) in million EUR; Right panel: age dependency ratio (adr) and real spending on social protection benefits (r_spb) in million EUR; all data for 28 EU-average.
Source: own work based on Eurostat data
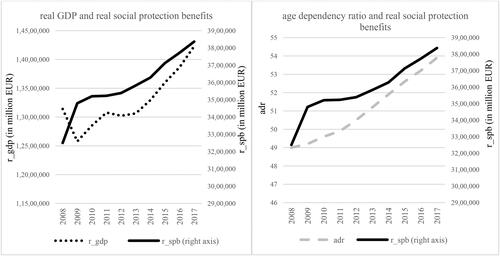
Table 1. Results of the regressions, baseline PCSE technique and robustness checks, specifications with the age dependency ratio.
Table 2. Results of the regressions, baseline PCSE technique and robustness checks, specifications with the old-age dependency ratio and the young-age dependency ratio.
Table A1. Descriptive statistics and data sources.
Table A2. Im-Pesaran-Shin unit root test (with a trend, p-value in parentheses).
Table A3. Correlation matrix for variables in baseline specification.
Table A4. Descriptive statistics – first differenced variables in baseline specification.
Table A5. Diagnostic tests.
Table A6.1. Robustness checks, results for and
specifications with the age dependency ratio, N = 468.
Table A6.2. (continuation) Robustness checks, results for and
specifications with the age dependency ratio, N = 468.
Table A7.1. Robustness checks, results for and
specifications with the old-age dependency ratio and the young-age dependency ratio, N = 468.
Table A7.2. (continuation) Robustness checks, results for and
specifications with the old-age dependency ratio and the young-age dependency ratio, N = 468.
Table A8. Robustness checks, results for and
specifications with the age dependency ratio and institutional controls, N = 468.
Table A9. Robustness checks, results for and
specifications with the old-age dependency ratio and the young-age dependency ratio and institutional controls, N = 468.