
Figures & data
Table 1. Sample selection, sample number deleted and illustration of deleted reasons.
Table 2. Descriptive statistics of the unexpected earnings response coefficient, Per, RPer.
Table 3. The univariate regression results of Per, RPer and unexpected earnings response coefficient.
Table 4. The combined regression results of Per, RPer and unexpected earnings response coefficient.
Table 5. Descriptive statistics based on the characteristic classification of dividends payout rates.
Table 6. The combined regression results based on dividends payout ratio classification.
Figure 1. Multiple box plots of Per value and RPer value with different dividend payout ratio (from low to the high).
Source: Authors’ calculation.
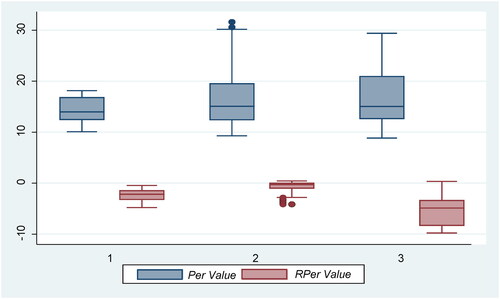
Table 7. Descriptive statistics by characteristics of firms’ ROE.
Figure 2. The multiple box plots of Per and RPer with different R.O.E. (from low to the high).
Source: Authors’ calculation.
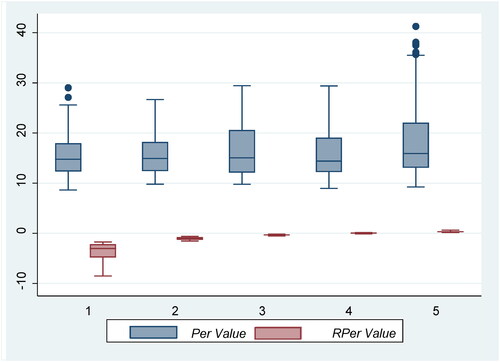
Table 8. Descriptive statistics based on firm size characteristics (sales) classification.
Table 9. Combined regression results of Per, RPer and unexpected earnings response coefficient.