
Figures & data
Table 1. Variables specifications and sources.
Table 2. Descriptive and normality statistics.
Table 3. Slope heterogeneity.
Table 4. Cross-section dependence.
Table 5. Unit root testing (Pesaran, Citation2007).
Table 6. Cointegration results (Westerlund, Citation2007).
Table 7. Westerlund and Edgerton panel cointegration analysis with structural breaks.
Table 8. Estimates of quantile regression – MMQR.
Figure 1. Graphical representation of quantiles.
Source: drawn by the authors.
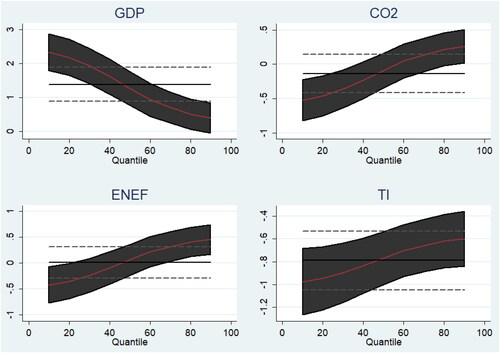
Table 9. Robust test results – BSQR.
Table 10. Dumitrescu-Hurlin panel causality.