Figures & data
Table 1. Total and per capita household income in China.
Table 2. Measurement results of inequality index.
Figure 1. Gini coefficient of household income in China from 2006 to 2017.
Source: CSS survey data from 2006 to 2017.
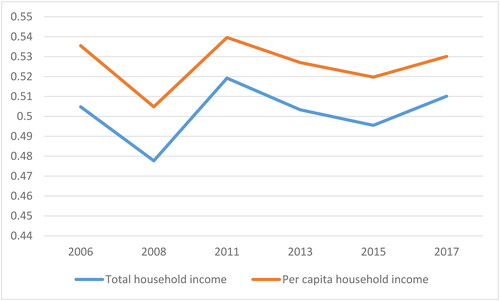
Figure 2. Estimation of adaptive Kernel density of total household income.
Source: CSS survey data from 2006 to 2017.
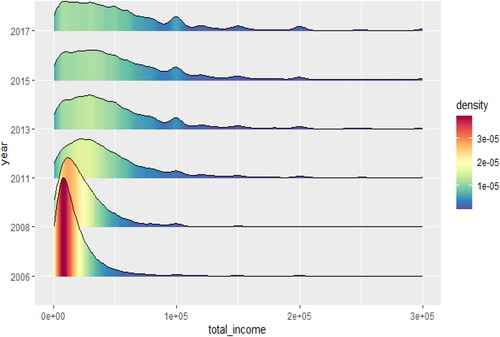
Figure 3. Estimation of adaptive Kernel density of per capita household income.
Source: CSS survey data from 2006 to 2017.
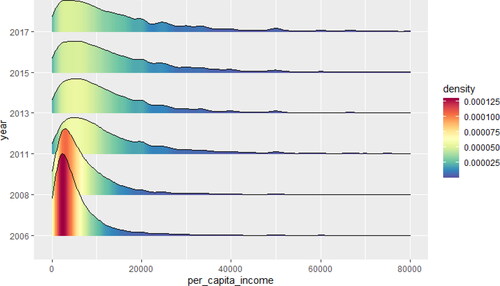
Figure 4. Distribution of total household income in China from 2006 to 2017.
Source: CSS survey data from 2006 to 2017.
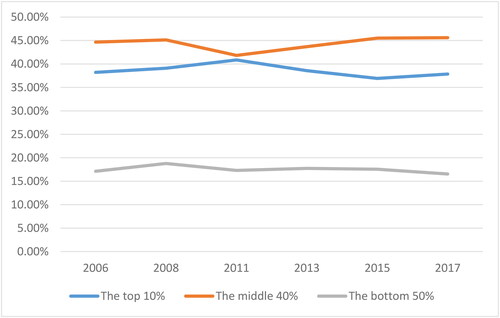
Figure 5. Distribution of the number of households of different sizes in China.
Source: CSS survey data from 2006 to 2017.
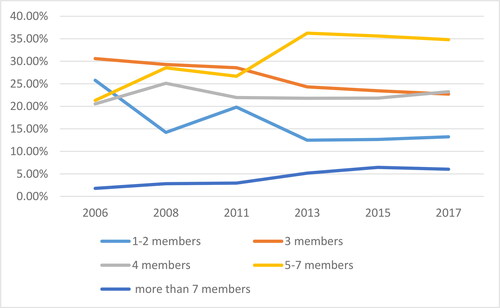
Figure 6. Distribution of total household income inequality in China: differences in household size.
Source: CSS survey data from 2006 to 2017.
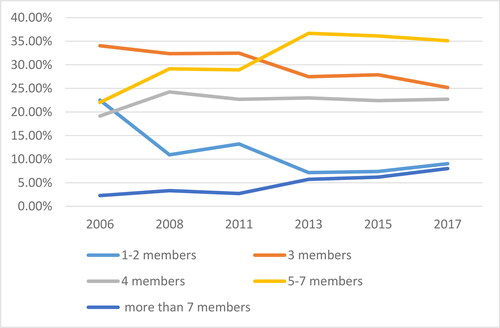
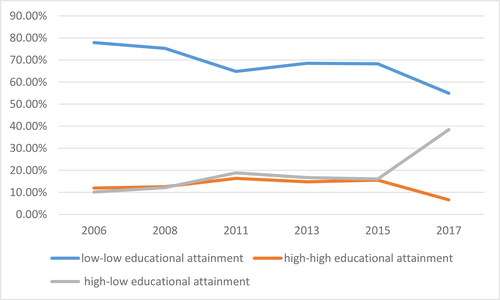
Figure 7. Proportion of household heads with different educational attainment.
Source: CSS survey data from 2006 to 2017.
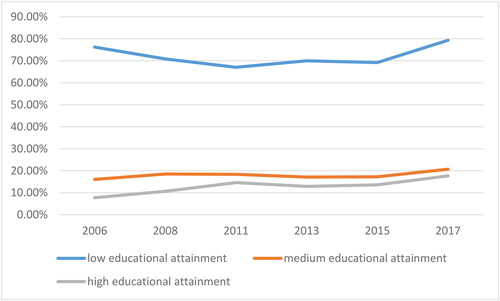
Figure 8. Inequality distribution of total household income in China: differences in the educational attainment of household heads.
Source: CSS survey data from 2006 to 2017.
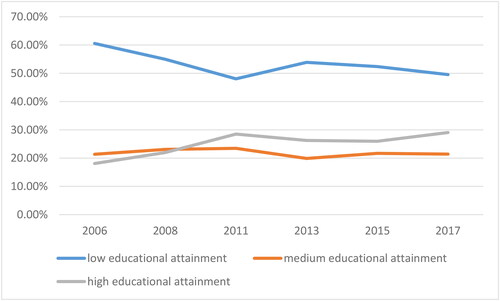
Figure 9. Sample proportion of different marital structures.
Source: CSS survey data from 2006 to 2017.
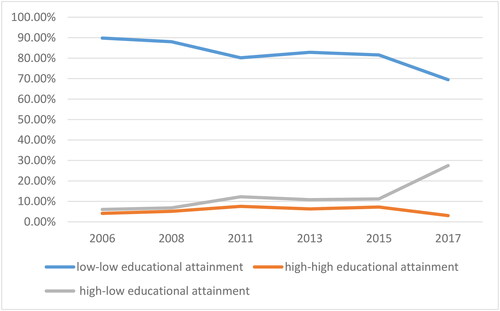
Figure 10. Inequality distribution of total household income in China: differences in marital structure.
Source: CSS survey data from 2006 to 2017.