Figures & data
Table 1. Average corporate debt recovery rates measured by trading prices.
Table 2. Average corporate debt recovery rates measured by ultimate recoveries, 1987–2017.
Table 3. Average senior unsecured bond recovery rates by year prior to default, 1983–2017.
Table 4. Estimated recovery rates for leasing contracts.
Figure 1. Default-tree model.
Source: compiled by the authors
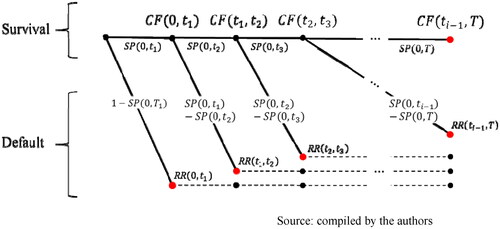
Table 5. Default tree scenarios and bond net present value.
Table 6. Default tree scenarios and bond net present value for a new recovery rate = 50%.
Figure 2. Basic Materials sector, BB-rated YTM curve (%), 30/09/21.
Source: Reuters and compiled by the authors
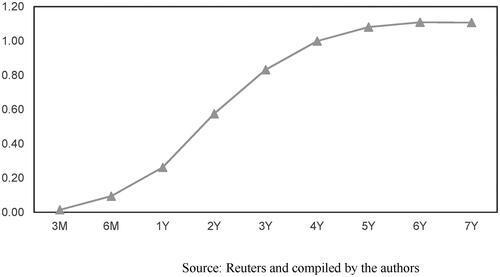
Table 7. Basic materials sector, BB-rated YTM curve bond constituents, 30/09/21.
Figure 3. Basic Materials sector, BB standard and shifted YTM curves, 30/09/2021.
Source: Reuters and compiled by the authors
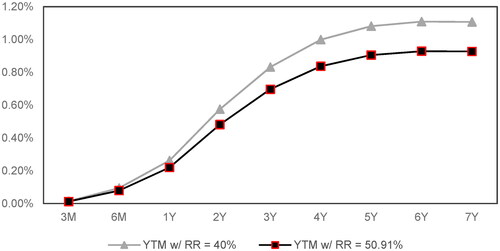
Table 8. Several outstanding bonds for BBVA, SA, for several seniority tranches, 30/09/21.
Table 9. Several outstanding bonds for BBVA, SA, for several seniority tranches, and model outputs, 30/09/2021.
Table 10. Several outstanding bonds for CaixaBank, for several seniority tranches, 30/09/2021.
Table 11. Several outstanding bonds for CaixaBank, for several seniority tranches, and model outputs, 30/09/21.
Table 12. Initial sample.
Table 13. Bonds used for model testing, 30/09/2021.
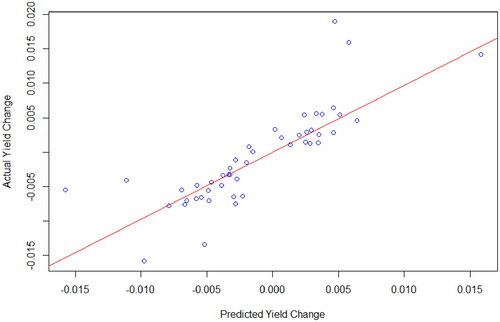
Figure 4. OLS regression, Predicted ΔYTM vs Actual ΔYTM, 30/09/2021.
Source: compiled by the authors
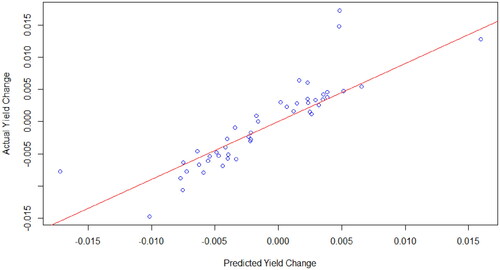
Figure 5. Normal Q-Q Plot, Predicted ΔYTM vs Actual ΔYTM, 30/09/2021.
Source: compiled by the authors
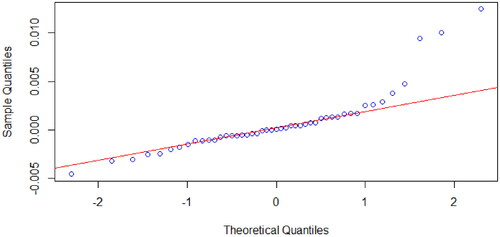
Figure 6. OLS regression without outliers, Predicted ΔYTM vs Actual ΔYTM, 30/09/2021.
Source: compiled by the authors
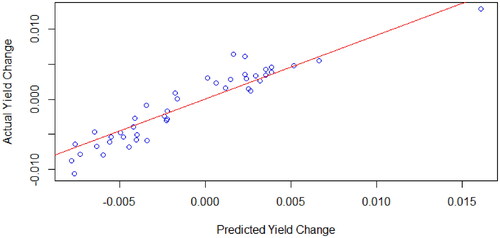
Figure 7. Normal Q-Q Plot for regression residuals w/out outliers, Predicted ΔYTM vs Actual ΔYTM, 30/09/2021.
Source: compiled by the authors
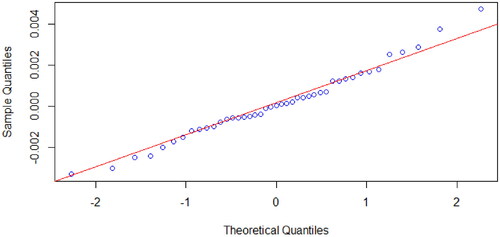
Figure 8. Cook’s distance for regression residuals w/out outliers, Predicted ΔYTM vs Actual ΔYTM, 30/09/2021.
Source: compiled by the authors
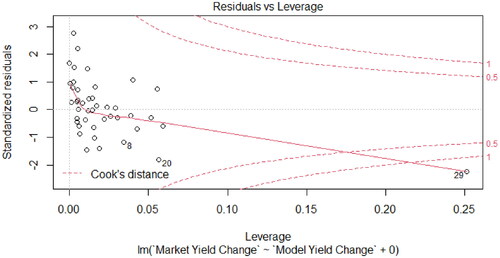
Figure 9. Residuals fitting for Bootstrap resampling on Predicted ΔYTM, 30/09/2021.
Source: compiled by the authors
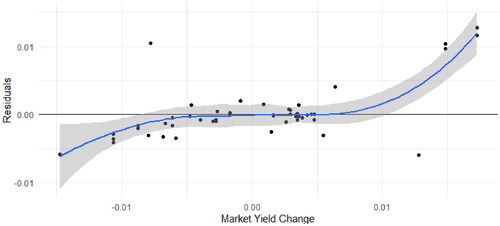
Figure 10. Residuals fitting for Bootstrap resampling on Predicted ΔYTM, without outliers, 30/09/2021.
Source: compiled by the authors
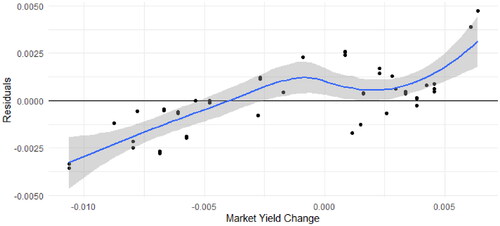
Figure 11. Residuals fitting for Repeated K-Folds on Predicted ΔYTM, 30/09/2021.
Source: compiled by the authors
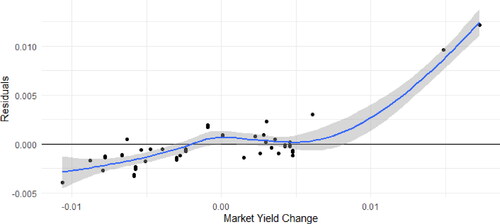
Figure 12. Residuals fitting for Repeated K-Folds on Predicted ΔYTM, without outliers, 30/09/2021.
Source: compiled by the authors
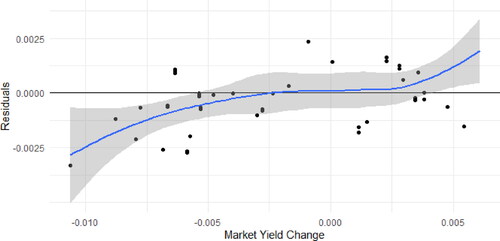
Figure 13. OLS regression, Predicted ΔYTM vs Actual ΔYTM, 20/03/2020.
Source: compiled by the authors