
Figures & data
Table 1. Descriptive statistics of returns and realized measure.
Figure 1. Closing price sequence of the CSI 300 index.
Source: authors.
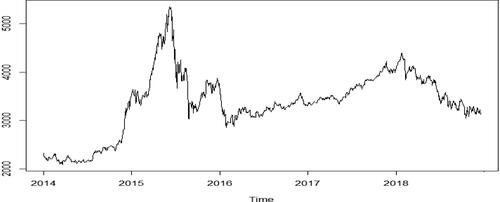
Figure 2. Daily return series of the CSI 300 index.
Source: authors.
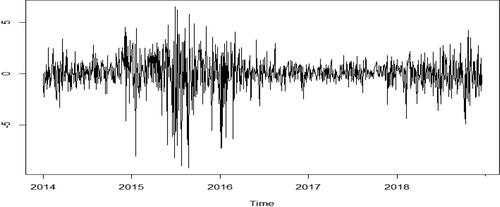
Figure 3. Realized volatility.
Source: authors.
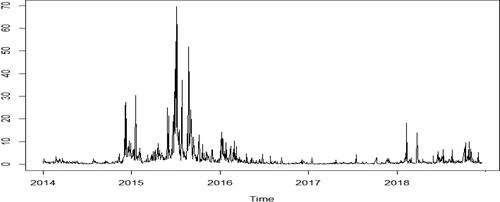
Table 2. Estimation results of GARCH model parameters.
Table 3. Estimation results of Realized GARCH model parameters.
Table 4. The results of the PT test.
Table 5. Loss function value of volatility prediction.
Table 6. The results of MCS test.
Table 7. The results of PT test for different realized measures.
Table 8. MCS test results of different realized measures.
Table 9. The results of PT test in different look-back periods.
Table 10. The results of MCS test in different look-back periods.
Table 11. The results of PT test of different data.
Table 12. MCS test results of different data.