
Figures & data
Figure 1. Average annual income of parents and children in general.
Source: drawn by author.
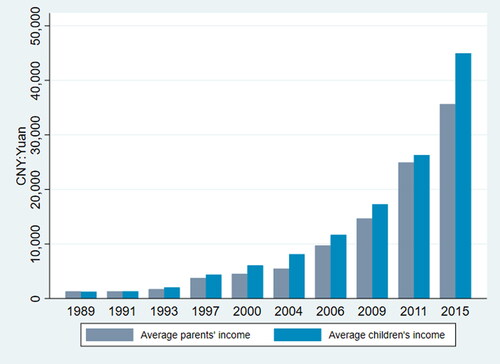
Figure 2. Average annual years of schooling of parents and children in general.
Source: drawn by author.
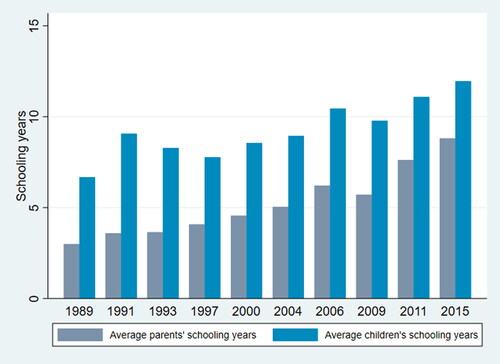
Figure 3. Average annual income of parents and children in urban areas.
Source: drawn by author.
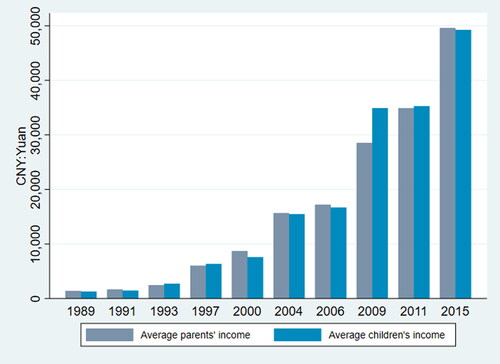
Figure 4. Average annual years of schooling of parents and children in urban areas.
Source: drawn by author.
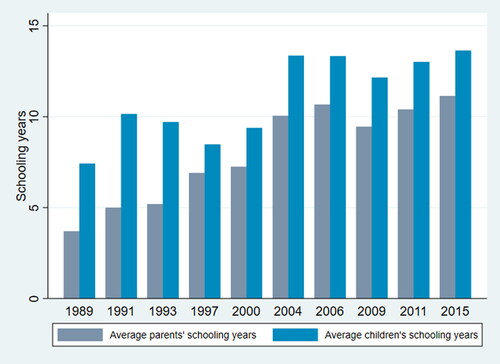
Figure 5. Average annual income of parents and children in rural areas.
Source: drawn by author.
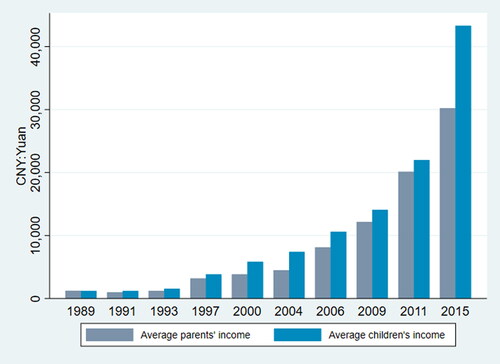
Figure 6. Average annual years of schooling of parents and children in rural areas.
Source: drawn by author.
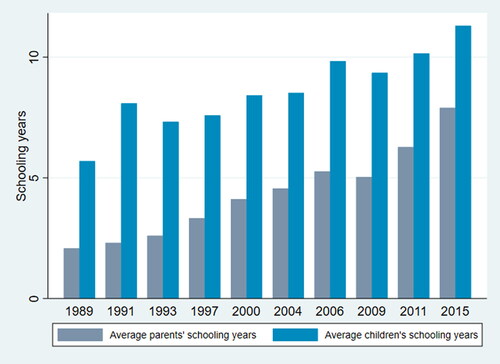
Table 1. Summary statistics.
Table 2. Effect of education upward mobility (EUM) on income upward mobility (IUM).
Table 3. Influence of intergenerational psychological distance (IPD).
Table 4. Influence of parents’ social capital.
Table 5. Analysis of gender heterogeneity via basic regression.
Table 6. Analysis of gender heterogeneity of influence of intergenerational psychological distance (IPD).
Table 7. Analysis of effect of gender heterogeneity on the influence of parents’ social capital.
Table 8. Robustness check using alternative measurements.
Table 9. Robustness check using an instrumental variable.
Table 10. Robustness check on subsample: influence of college expansion policy.