Figures & data
Table 1. Test for equality of GDP’s mean average growth rates (p-values by pair of regions).
Figure 1. Correlation with regional GDP growth.
Source: authors own calculations and estimations.
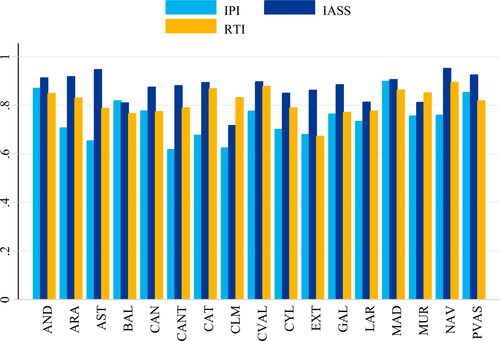
Figure 2. Evolution of IPI & SSC during the lockdown.
Source: authors own calculations and estimations.
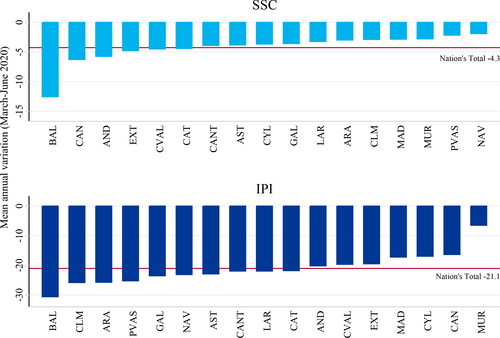
Table 2. Percentage of the variance explained by the common factor by region.
Figure 3. Estimated GDP by region.
Source: authors own calculations and estimations.
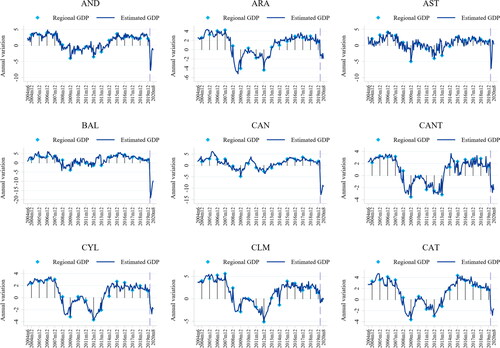
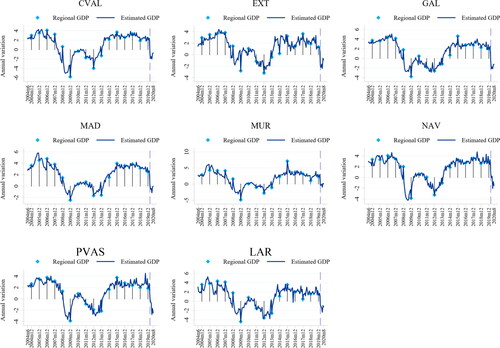
Table 3. Ratio of GDP Root Mean Squared Error (by subperiod & region) .
i denotes the corresponding row subperiod while all includes all the indicated subperiods. Subperiod dating is done acording to expansions/recessions dated by the Spanish Business Cycle Dating Committee.
Figure 3. Estimated GDP by region - panel B.
Figure 4. Estimated GDP by region.
Source: authors own calculations and estimations.
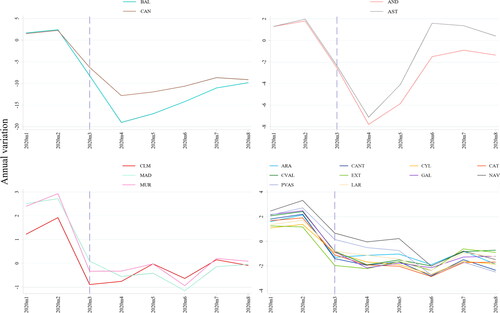
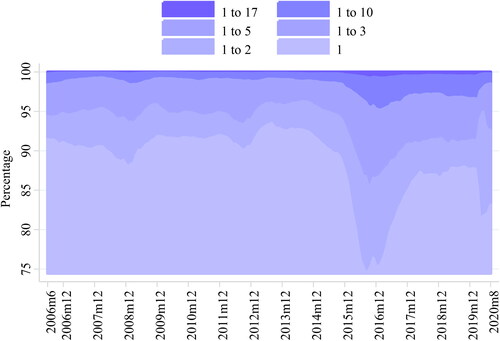
Figure 5. Percentage of the variance explained by different number of eigenvalues.
Source: authors own calculations and estimations.