Figures & data
Figure 1. The dynamics of NPLs in the banking sector (Data source: CBRC).
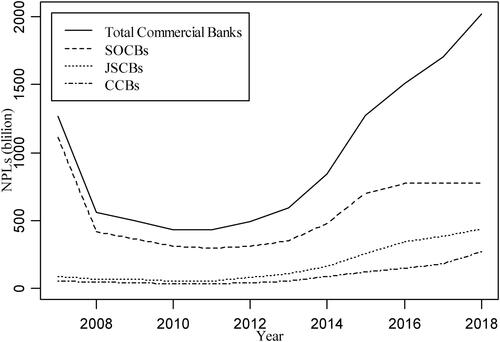
Table 1. Descriptive statistics of the stock returns.
Figure 2. China’s stock price indices and financial risk events.
Source: Created by the authors.
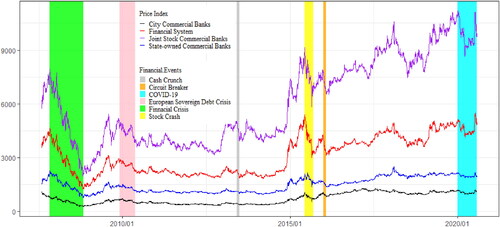
Figure 3. Histograms and PDFs of the stock returns.
Source: Created by the authors.
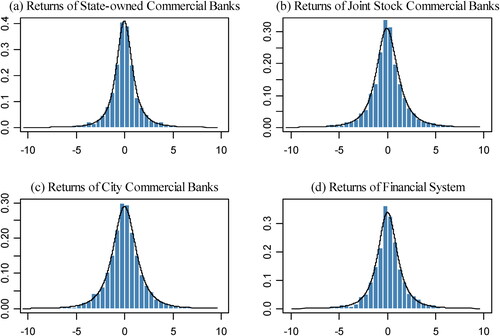
Figure 4. QQ plots of the stock returns.
Source: Created by the authors.
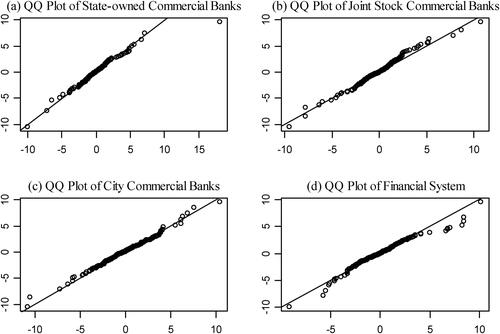
Table 2. Estimates of parameters of the SKST distribution function.
Figure 5. Fitted curves of the CQR models.
Source: Created by the authors.
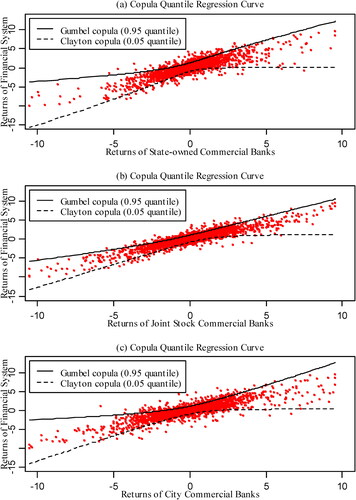
Table 3. Estimates for the CQR models.
Table 4. Estimates of downside and upside tail dependence coefficients.
Table 5. Static risk spillovers of downside risk.
Table 6. Static risk spillovers of upside risk.
Figure 6. The dynamics of downside risk spillovers from the three kinds of banks to financial system in China over period from 2 December 2014 to 31 July 2020.
Source: Created by the authors.
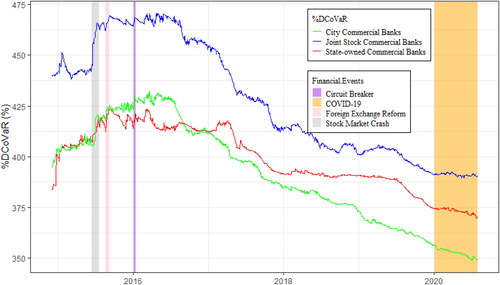
Figure 7. The dynamics of upside risk spillovers from the three kinds of banks to financial system in China from 2 December 2014 to 31 July 2020.
Source: Created by the authors.
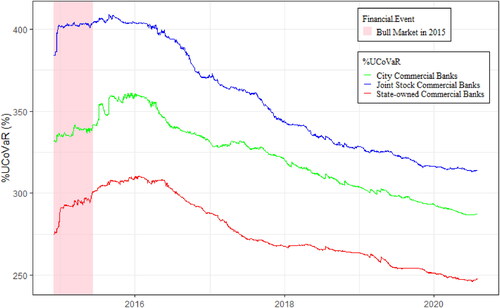
Table 7. Dominance tests for the risk spillovers.
Table 8. Significance tests for the risk spillovers.
Table 9. Asymmetry tests for the risk spillovers from banks to China’s financial system.
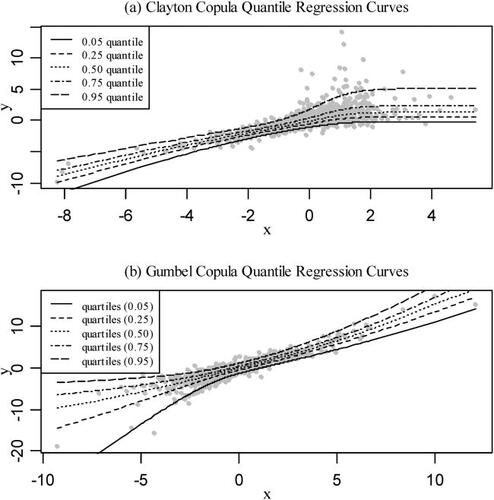
Figure A1. Clayton and Gumbel CQR curves.
Source: Created by the authors.