
Figures & data
Figure 1. Conceptual model.
Source: Author's creation.
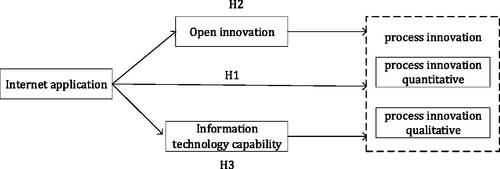
Table 1. Descriptive statistics of variables.
Table 2. Baseline regression results of Internet application affecting process innovation.
Table 3. Average marginal effect estimation results.
Table 4. Regression results of instrumental variables.
Table 5. Heterogeneity analysis for distinguishing firm size differences.
Table 6. Heterogeneity analysis for distinguishing industry differences.
Table 7. Heterogeneity analysis for distinguishing ownership differences.
Table 8. Heterogeneity analysis for distinguishing regions’ differences.
Table 9. Results of intermediate effect test.