
Figures & data
Table 1. Descriptive statistics and normality.
Table 2. Cross-section dependence.
Table 3. Stationarity testing.
Table 4. Cointegration test.
Table 5. MMQR estimates.
Figure 1. Graphical depiction of bootstrap quantile regression coefficients.
Source: Authors Own Visualization.
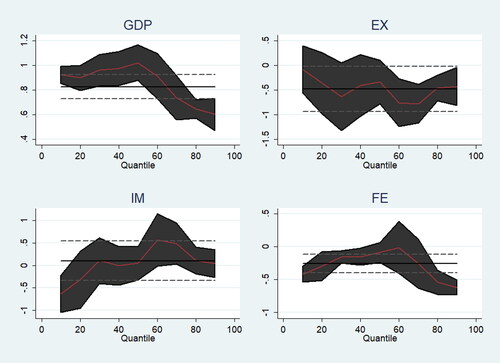
Table 6. Robustness – bootstrap quantile regression.
Table 7. Parametric robust analysis.