
Figures & data
Table 1. Description of variables.
Table 2. Descriptive statistics.
Figure 1. Correlation of model variables.
Source: Authors own estimations.
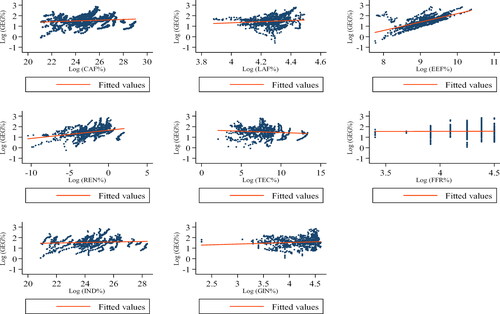
Table 3. VIF Statistic.
Table 4. CD test and first-generation unit root test.
Table 5. Westerlund panel cointegration.
Table 6. Results of MMQR.
Figure 2. Graphic representation of the MMQR, FMOLS, DOLS and FE-OLS coefficients.
Source: Authors own estimations.
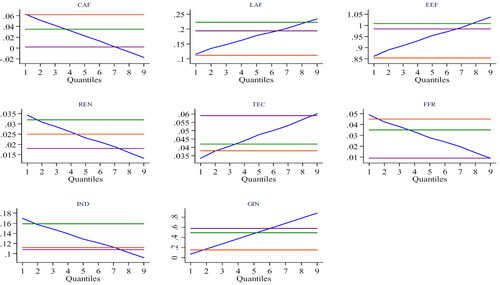
Table 7. The results of Dumitrescu–Hurlin panel causality tests.
Table A1. Countries examined.
Table A2. Results panel estimation.