
Figures & data
Table 1. Kapetanios and Shin (Citation2008) unit root test.
Table 2. ARFIMA structure of the returns series.
Table 3. BDS test results.
Table 4. Markov regime switching regression.
Figure 1. Dynamic conditional correlation graphs (DCC-GARCH). Source: Authors' estimations/calculations.
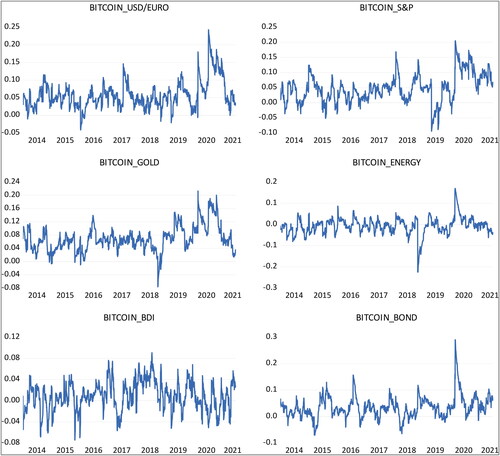
Figure 2. Filtered regime probabilities.
Note: The Figure represents the transition probabilities of all the assets under the study in a two-regime Markov Regime Switching Regression Model. The graphs indicate that Bitcoin and Gold mostly stay in Regime 1 (Bullish Regime) with a considerably low transition to Regime 2 (Bearish Regime). USD/EUR demonstrates a constant transition between the regimes and almost equal durations in either regime. BDI, likewise, exhibits a high probability for both regimes to exist with a considerable probability to transition between the regimes. On the other hand, S&P 500, Energy, and Bonds tend to mostly stay in regime in Regime 2 (Bearish Regime) with a considerable probability of transition from Regime 1 to Regime 1. Source: Authors' estimations/calculations.
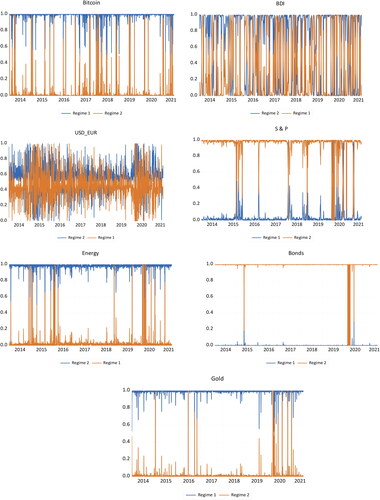
Table 5. Transition probabilities.