
Figures & data
Table 1. Variable definition and sources.
Table 2. Summary of descriptive statistics of dependent and independent variables included in our model.
Table 3. Correlation matrix.
Table 4. Regression results of digitalization and tax evasion.
Figure 1. The relationship between digitalization and tax evasion in low corruption and high corruption countries.
Source: Authors' Calculations.
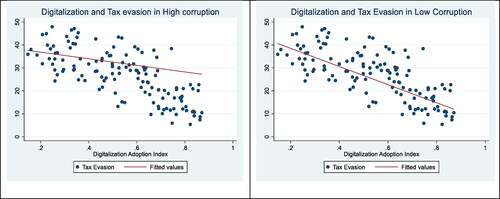
Table 5. Regression results of digitalization and tax evasion in high-corruption and low-corruption countries.
Figure 2. The moderation effect of corruption on the relationship between digitalization and tax evasion (interaction plot).
Source: Authors' Calculations.
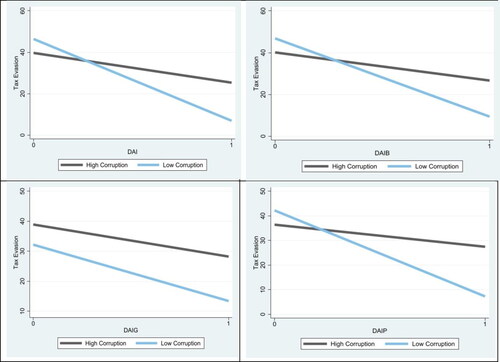
Table 6. Testing the moderation effect of corruption on the relationship between digitalization and tax evasion.
Table A1. Data collected for the countries included in study sample.