Figures & data
Figure 1. The floor space and building area of functional areas in the TAIYUAN cultural tourism town. Note: A refers to the floor space; B is the building area.
Source: authors’ work.
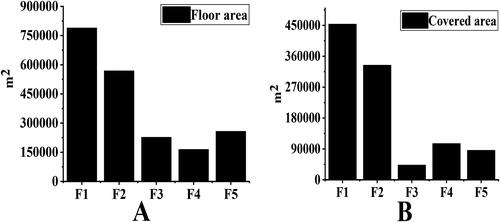
Figure 2. The industry chain diagram of China’s characteristic cultural tourism towns.
Source: authors’ work.
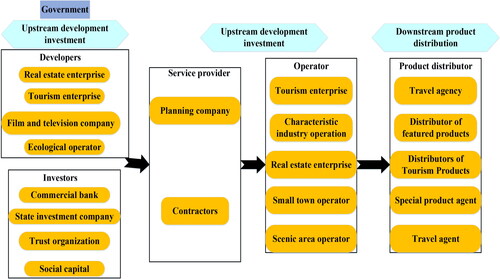
Figure 3. The evaluation index system of the social results of cultural tourism towns.
Source: authors’ work.
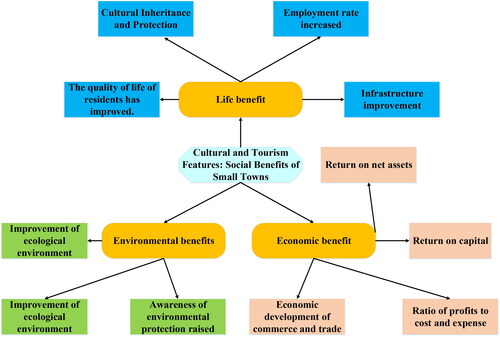
Table 1. Evaluation index of the social results of cultural tourism towns.
Table 2. Expert scoring table.
Table 3. Calculation of the weight value of the W-G judgment matrix.
Figure 4. Three-layer BP neural network structure.
Source: authors’ work.
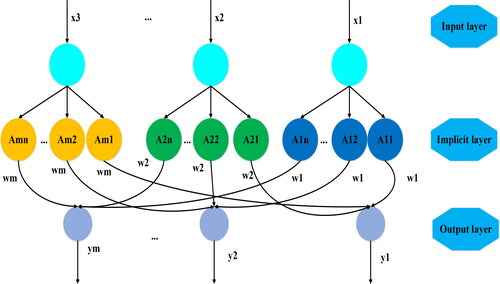
Figure 5. Schematic diagram of the construction of the BP-fuzzy comprehensive evaluation model for the social results of cultural tourism towns.
Source: authors’ work.
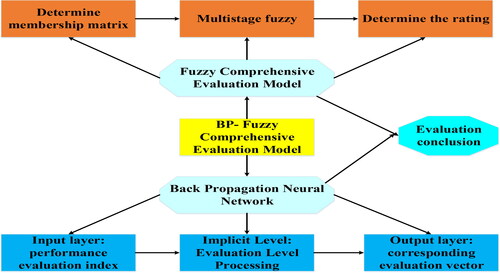
Table 4. Calculation of the weight value of the G1-H judgment matrix.
Table 5. Calculation of the weight value of the G2-H judgment matrix.
Figure 6. Relative weight of index layer factors (H8, H9, H10 and H11) on G1 of criterion layer.
Source: authors’ work.
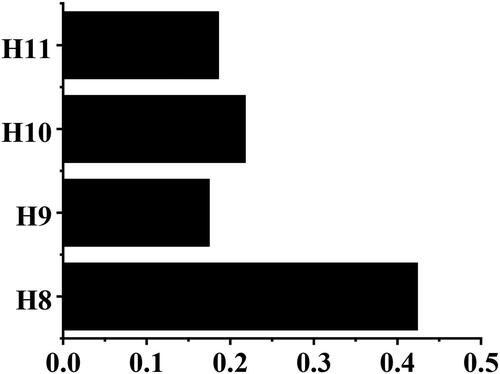
Table 6. Calculation of the weight value of the G3-H judgment matrix.
Figure 7. The weight value of each factor of the index layer to the target layer W. (a) the index of life benefit; (b) the index of environmental benefit; (c) the economic benefit index.
Source: authors’ work.
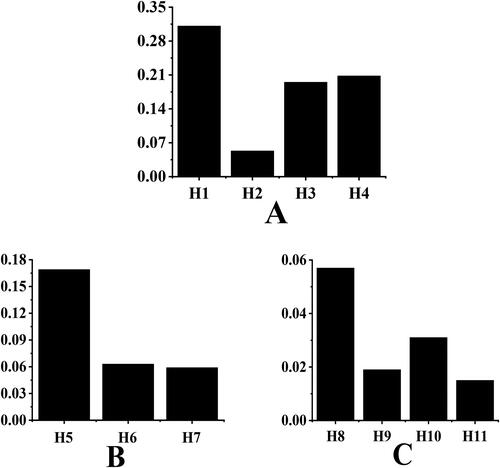
Table 7. The membership matrix of each index of life benefit.
Table 8. Membership matrix of each index of environmental benefit.
Table 9. Membership matrix of each index of economic benefit.
Table 10. Calculation of the weight value of the G3-H judgment matrix.
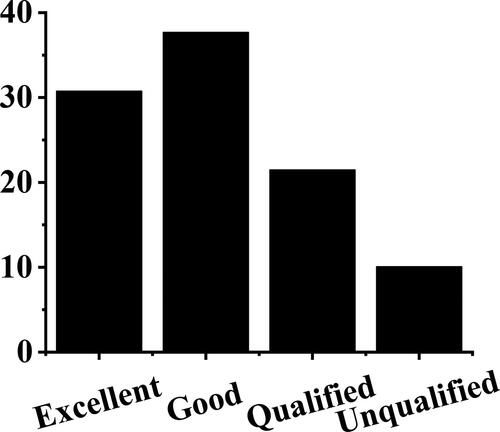
Figure 8. The results of the second-level fuzzy comprehensive evaluation.
Source: authors’ work.