
Figures & data
Figure 1. Quality of the welfare state and overall globalisation (1970–2018).
Source: own work based on KOF indices.
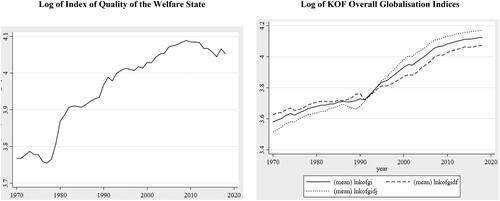
Figure 2. Scatter plot: Quality of the welfare state and KOF overall globalisation ındices (169 Countries, Period Average, 1970–2018).
Source: own work based on KOF indices.
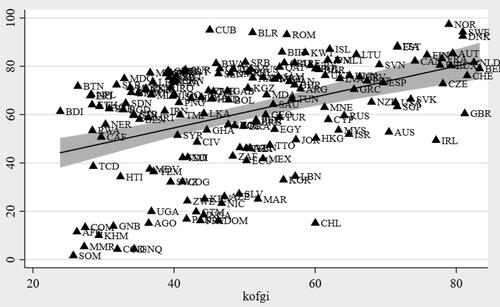
Table 1. FE estimations (Current model): Globalisation and quality of the welfare state (1970–2018).
Table 2. FE estimations (Lagged model): Globalisation and quality of the welfare state (1970–2018).
Table 3. FE estimations (Lagged model): Globalisation and quality of the welfare state (1970–2018) (Different stages of economic development).
Table 4. FE estimations (Lagged model): Economic globalisation and quality of the welfare state (1970–2018).
Table 5. System GMM estimations (Lagged model): Globalisation and quality of the welfare state (1970–2018).
Table 6. Robustness checks: FE estimations (Lagged model) (ıncluding additional controls).
Table 7. Robustness checks: FE estimations (Lagged model) (excluding the outliers).
Table A1. 169 countries in the sample.
Table A2. Descriptive statistics.
Table A3. Correlation matrix.