Figures & data
Figure 1. Economic growth, CO2 emissions, and trade in China.
Source: Franzen and Mader (Citation2016).
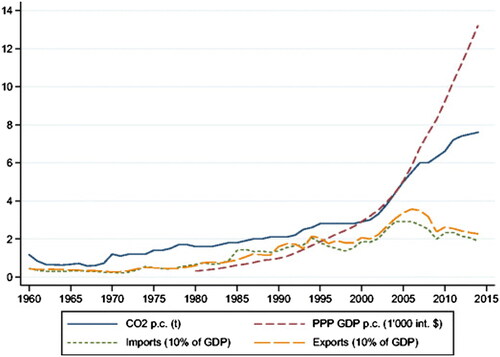
Table 1. Literature summary.
Table 2. Descriptive statistics.
Table 3. Testing for slope heterogeneity.
Table 4. Testing for cross-sectional dependence (CSD).
Table 5. Pesaran (Citation2007) panel unit root test.
Table 6. Westerlund ECM panel cointegrating tests.
Table 7. Method of moment quantile regression.
Table 8. Method of moment quantile regression.
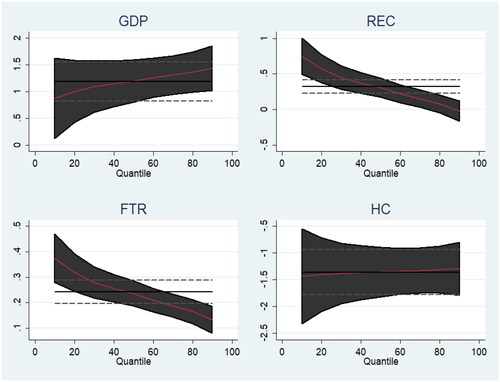
Figure 2. Method of moment quantile regression results.
Source: Authors own calculations.