
Figures & data
Figure 1. Tax burden rate of the financial industry.Footnote2
Source: National Bureau of Statistics of the People’s Republic of China from the collated statistical yearbooks of the past years.
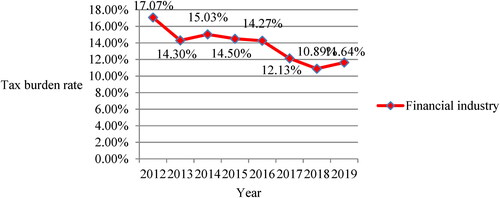
Table 1. Description of related data variables.
Table 2. Stability test results of each index.
Figure 2. Response of net profit growth rate year on year to the comprehensive tax burden.
Source: results of impulse response operation of the sorted data by stata software.
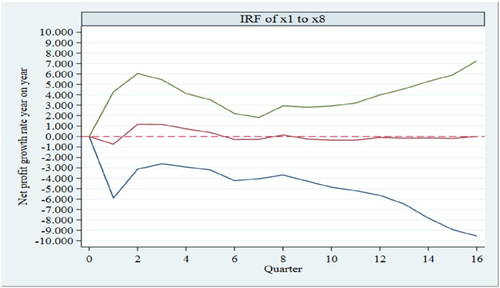
Figure 3. Response of net profit margin on sales to the comprehensive tax burden.
Source: results of impulse response operation of the sorted data by stata software.
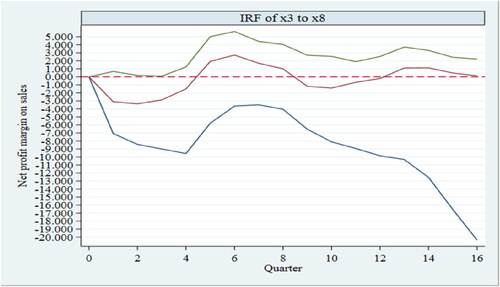
Figure 4. Response of total asset turnover rate to the comprehensive tax burden.
Source: results of impulse response operation of the sorted data by stata software.
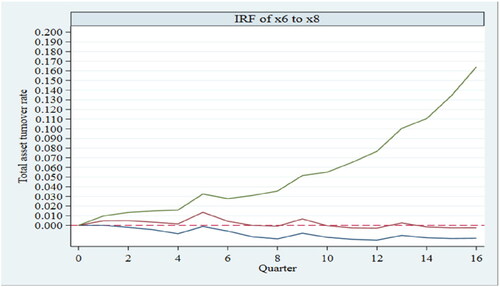
Figure 5. Response of debt to asset ratio to the comprehensive tax burden.
Source: results of impulse response operation of the sorted data by stata software.
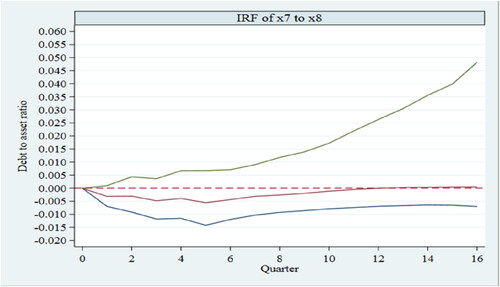
Table 3. Optimal lag order selection results.