
Figures & data
Figure 1. Evolution of selected variables over time (2012–2020).
Notes: Averages across DMUs. Average real turnover, assets and income in thousand dollars, deflated with the Consumer Index Price for G20. Source: own elaboration.
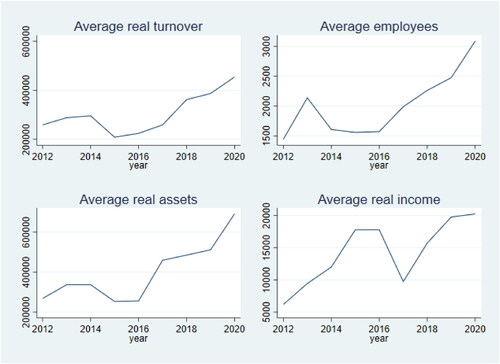
Table 1. Summary statistics, selected variables (2012–2020).
Table 2. Computation of efficiency, inputs and outputs.
Table 3. Efficiency scores, descriptive statistics.
Table 4. Efficiency estimators, correlations.
Table
Figure 2. Average bootstrap efficiency over time, Model 1 (2012–2020).
Source: own elaboration.
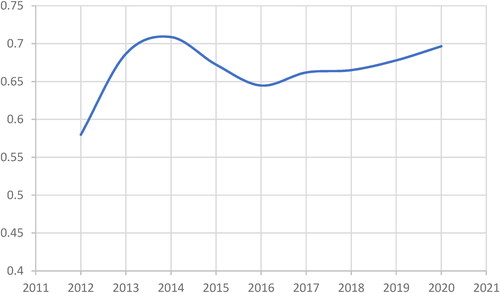
Table 5. Average efficiency scores of best performers, Model 1 (2012–2020).
Figure 3. Efficiency over time of the best performers.
Note: bootstrap efficiency, computed according to Model 1. Source: own elaboration.
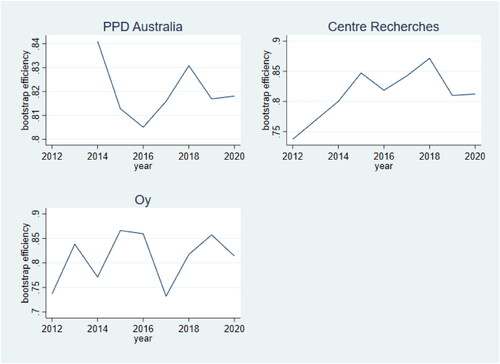
Figure 4. Persistence of efficiency.
Note: Efficiency computed according to Model 1. Source: own elaboration.
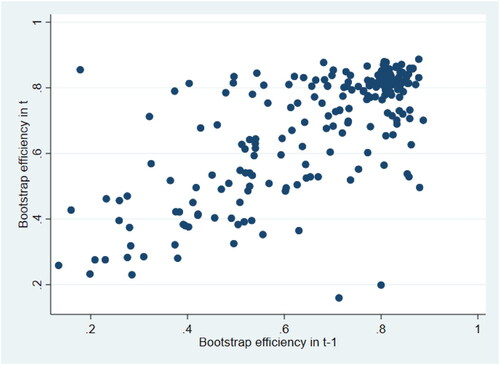
Table 6. Mean efficiency by size.