Figures & data
Figure 1. The overall framework of methodology.
Source: Authors' research.
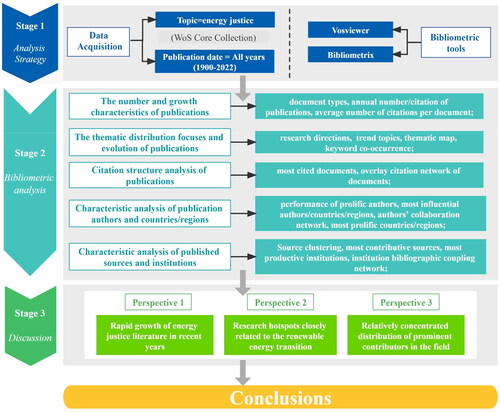
Figure 2. The type distribution of EJ publications.
Source: Authors' research.
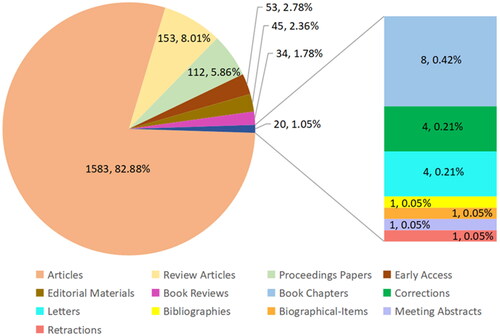
Figure 3. The number of annual EJ publications.
Source: Authors' research.
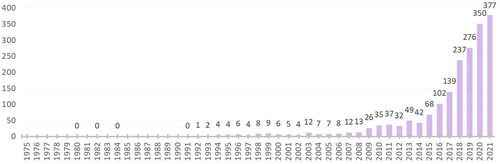
Figure 4. The number of annual citations of EJ publications.
Source: Authors' research.
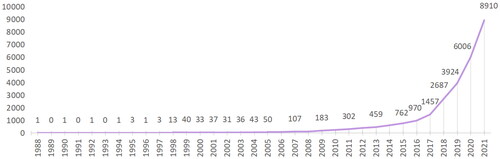
Figure 5. The average citations per EJ publications.
Source: Authors' research.
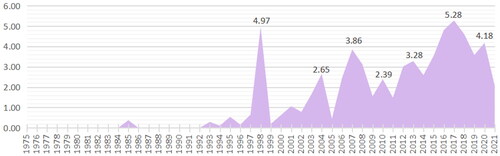
Figure 6. The bigrams trend topics in EJ publications.
Source: Authors' research.
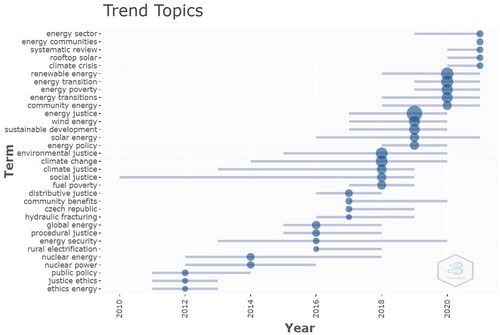
Figure 7. The bigrams thematic map of abstracts in EJ publications.
Source: Authors' research.
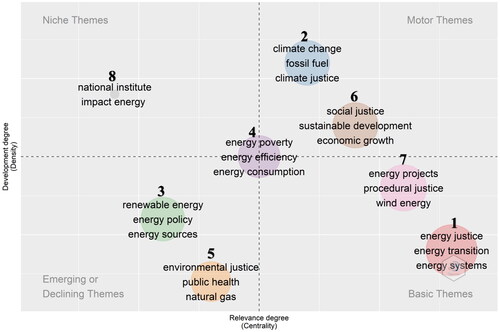
Figure 8. The co-occurrence network of all keywords in EJ publications.
Source: Authors' research.
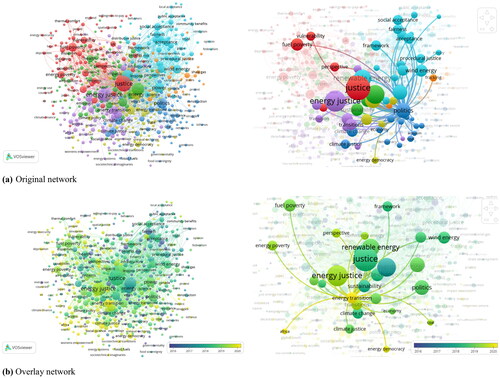
Table 1. The top 10 most cited EJ publications.
Figure 9. The overlay citation network of the EJ documents.
Source: Authors' research.
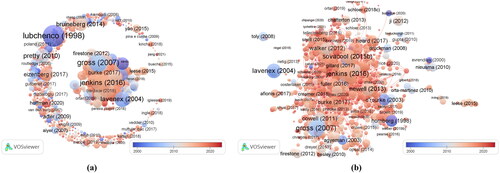
Figure 10. The performance of the top 20 prolific authors defined by distinct quantitative metrics.
Source: Authors' research.
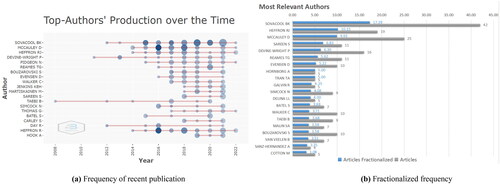
Table 2. The top 15 most influential authors based on NC in EJ.
Figure 11. The authors’ collaboration network based on TLS and AC.
Source: Authors' research.
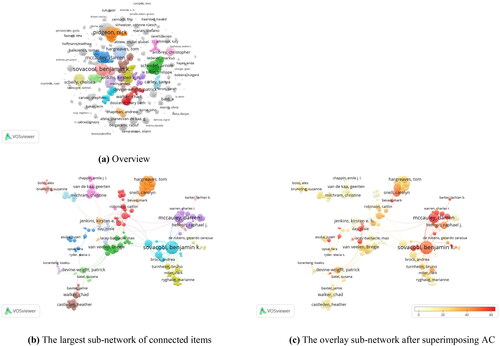
Figure 12. The top 20 most prolific countries/regions.
Source: Authors' research.
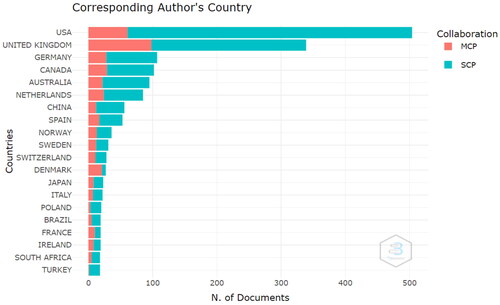
Table 3. The top 20 most influential countries/regions based on NC in EJ.
Figure 13. Source clustering through Bradford’s Law.
Source: Authors' research.
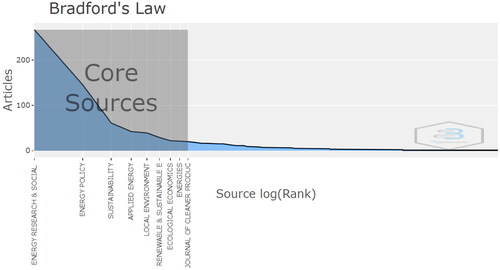
Table 4. The top 15 most contributive sources based on NC in EJ.
Figure 14. The top 20 most productive institutions in EJ publications.
Source: Authors' research.
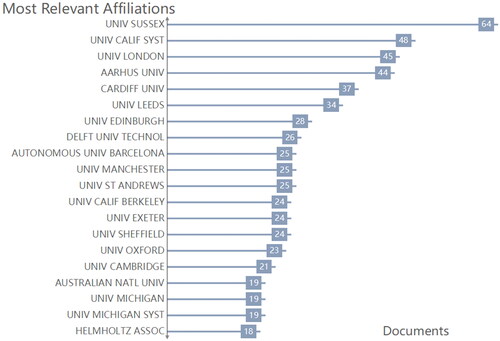
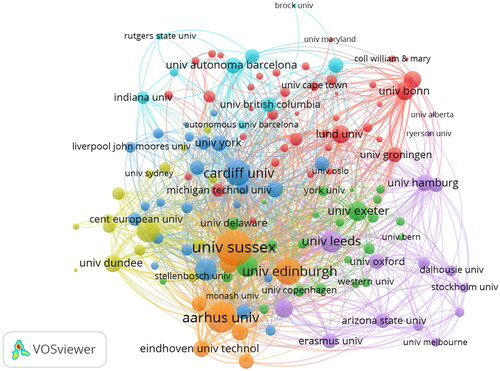
Figure 15. The institution bibliographic coupling network based on TLS.
Source: Authors' research.