560
Views
0
CrossRef citations to date
0
Altmetric
Research Article

Assessing the coordinative and coupling development of China’s green economic growth: role of sports economics

, &
Article: 2164037 | Received 18 Oct 2022, Accepted 26 Dec 2022, Published online: 15 May 2023

Figures & data

Figure 1. Scatter plots of selected variables.

Source: The authors.

Figure 1. Scatter plots of selected variables.Source: The authors.

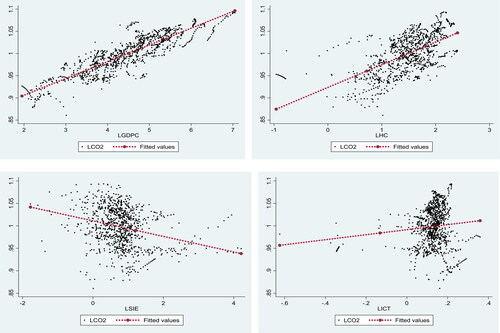
Table 1. Descriptive statistics.

Table 2. Correlation matrix.

Table 3. CADF and CIPS.

Table 4. Pedroni and Kao co-integration test.

Table 5. FMOLS long run test.

Table 6. DOLS long run test.

Table 7. Results of the D-H panel causality test.