
Figures & data
Figure 1. Schematic diagram of the mechanism of multidimensional poverty reduction effect of Urbanization.
Source: drawn by authors.
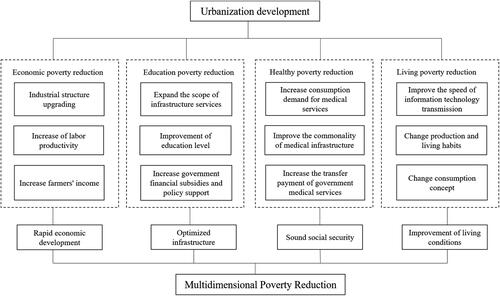
Table 1. Description of the weight matrix.
Table 2. System of indices to assess multidimensional poverty alleviation.
Table 3. The meanings and descriptions of the variables.
Table 4. Descriptive statistics.
Table 5. Moran’s I for urbanization and poverty in China.
Table 6. Results of tests of the spatial metrology model.
Table 7. Results of SDM for different dimensions of poverty.
Table 8. Direct, indirect, and total effects of urbanization on different dimensions of poverty.
Table 9. Examination of multidimensional poverty in different regions.
Table 10. Results of regression of the SDM based on the economic distance matrix.