
Figures & data
Figure 1. Theoretical framework graphical depiction.
Source: Created by authors, represents the theoretical framework as discussed in Section 2.1.
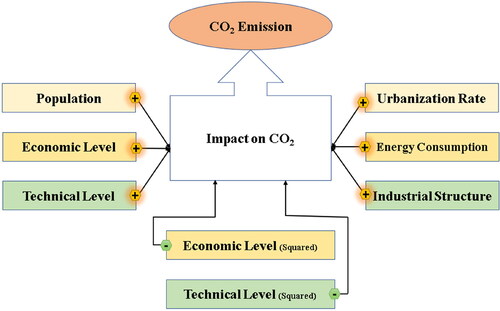
Table 1. Correlation coefficient of CO2 emissions from fossil energy.
Table 2. Coal dependency zones.
Table 3. Data statistics.
Table 4. The fixed effect regression results of the influencing factors of CO2 in each province from 2005 to 2019.
Table 5. The fixed effect regression results of the influencing factors of CO2 in each province from 2005 to 2019.