
Figures & data
Figure 1. China’s leather industry location entropy in 2000–2019.
Source: Authors compilation.
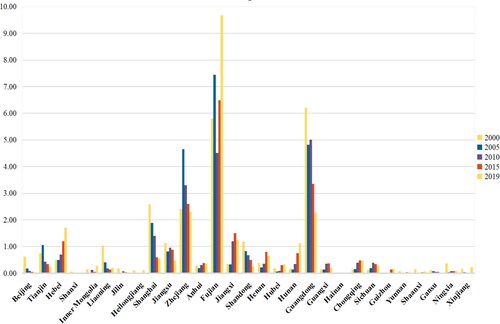
Figure 2. The spatial pattern of Chinese leather industry.
Source: Authors compilation.
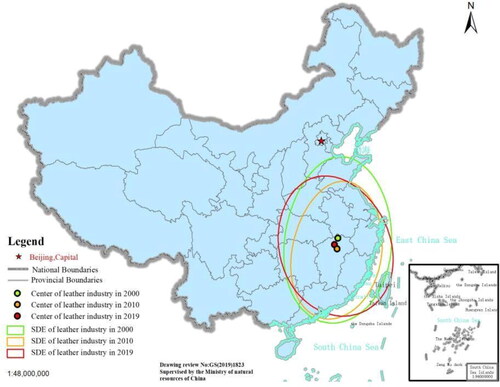
Figure 3. Moran’s I of leather industry agglomeration from 2000 to 2019.
Source: Authors compilation.
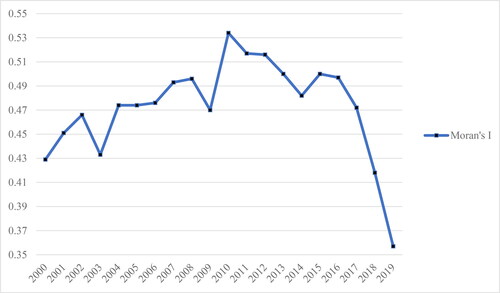
Table 1. Regression results of spatial models.
Table 2. Effect decomposition results of the spatial durbin model.
Table 3. Results of robustness tests.
Table 4. Estimation results of the group regression.
Table 5. Effect decomposition results of the group regression.