
Figures & data
Figure 1. Trend of housing prices and the intensity of central government regulatory policies, 1998-2016.
Note: The left axis represents housing prices, data from the CEI database. The right axis represents the number of real estate regulatory policies (only those at the central government level are counted), as determined by the text of previous year’s central government regulations.
Source: data from CEI (China Economic Information Network) database.
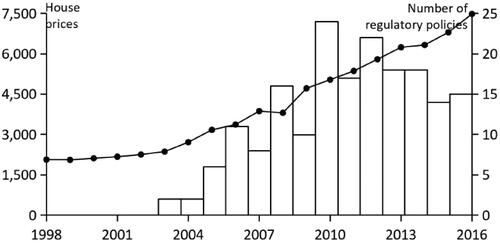
Table 1. Descriptive statistics for key variables.
Figure 2. Regions and 35 large- and medium-sized cities in China.Footnote4
Source: Map data are from DataV.GeoAtlas (http://datav.aliyun.com/portal/school/atlas/area_selector), then edited by the authors.
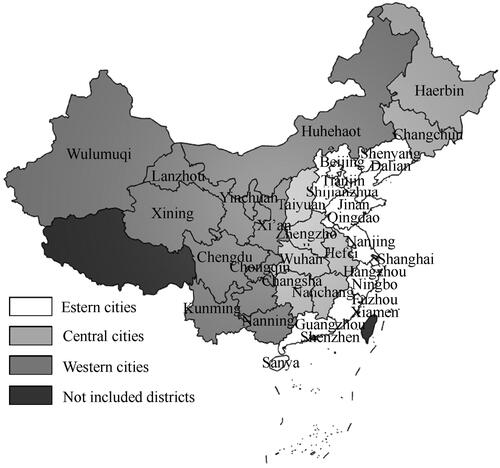
Figure 3. hp for 35 Large- and Medium-sized Cities and Cities in the Eastern, Central and Western.
Source: Authors’ research.
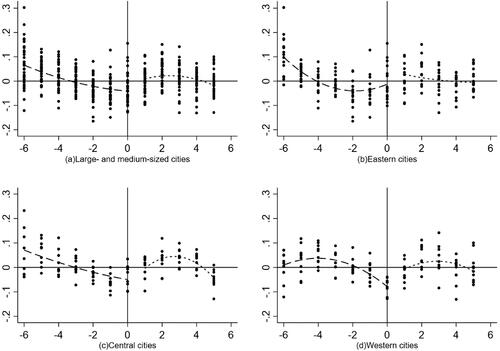
Table 2. Tests for continuity of control variables.
Table 3. Impact of the long-term mechanism implementation on housing prices.
Table 4. heterogeneity test (grouped by first- and second-tier cities).
Table 5. Heterogeneity test (grouped by eastern, central and western cities).
Table 6. Placebo test: set the long-term mechanism implementation date to the end of 2014.