
Figures & data
Table 1. Intra-industry index development scenarios.
Figure 1. Development of foreign trade between Slovakia and Kazakhstan in the years 2011–2020 (in millions of euros).
Source: author’s own processing based on ITC data (2022)
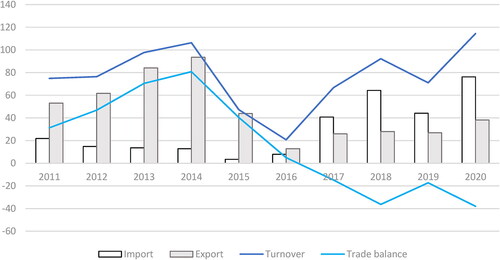
Figure 2. Development of the trade intensity index between Slovakia and Kazakhstan 2011–2020.
Source: author’s own processing based on ITC data (2022)
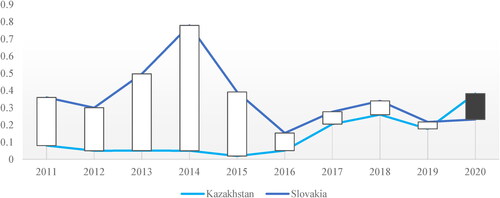
Figure 3. Development of trade complementarity between Slovakia and Kazakhstan in the years 2009–2020.
Source: author’s own processing based on ITC data (2022)
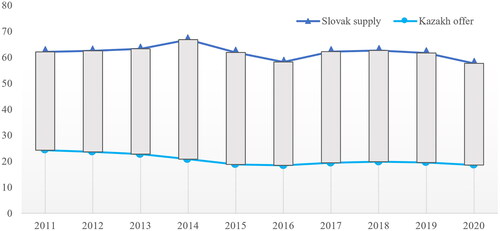
Table 2. GLI of the Slovak Republic with Kazakhstan in the years 2011 - 2020.
Table 3. Top 10 products of Slovak exports to Kazakhstan in 2020.
Table 4. Import-significant commodities for Kazakhstan at the level of HS4, for the period 2016-2020.