
Figures & data
Table 1. Variable measurement.
Table 2. Descriptive statistics.
Table 3. Correlations.
Table 4. t test of CAAR.
Figure 1. AARE for non-SOEs and SOEs during the event window.
Source: Author’s own.
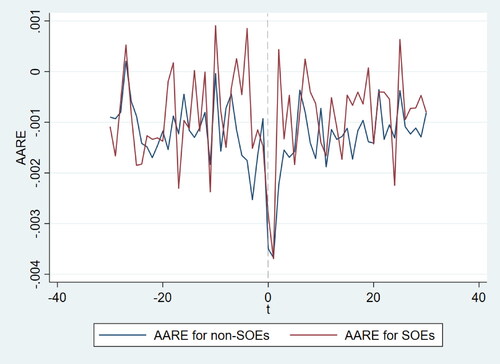
Figure 2. CAARE for non-SOEs and SOEs during the event window.
Source: Author’s own.
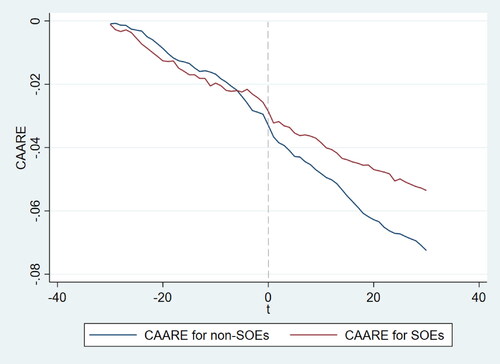
Table 5. t test of difference-in-means between non-SOEs and SOEs.
Table 6. Regression results.
Table 7. Regression results-continued.
Figure 3. (a) Moderation effect of affiliation level. (b) Moderation effect of industry regulation.
Source: Author’s own.
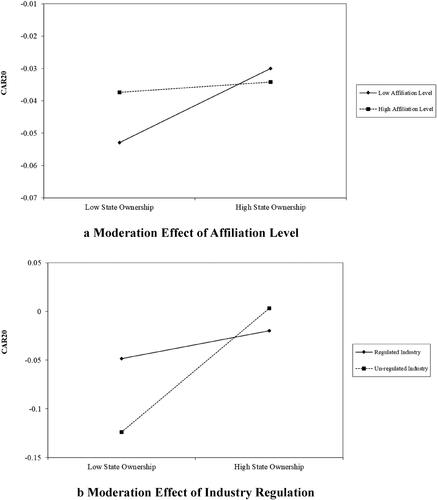
Table 8. Robustness check.