Figures & data
Figure 1. Conceptual framework operationalized in the current study.
Source: authors’ own estimations.
Figure 2. Cluster analysis of migrant workers of differen generation.
Source: authors’ own estimations.
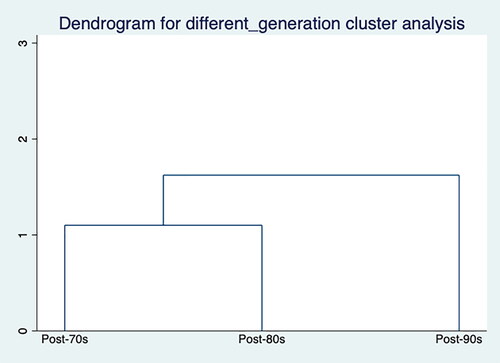
Table 1. Descriptive statistics.
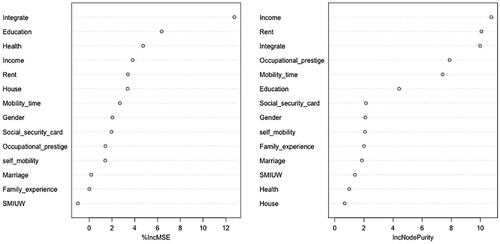
Figure 3. Percentage of “post-80s” migrant workers’ urbanization out-of-bag error and the importance of variables.
Source: authors’ own estimations.
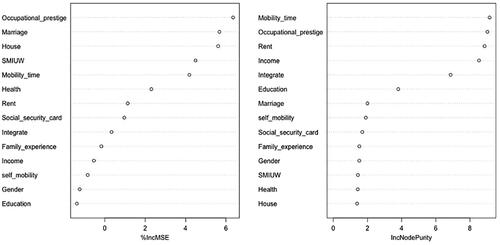
Table 2. Results of correlation between self-identity on the urbanization of “post-80s” and “post-90s” migrant workers.
Table 3. Results of the effect of self-identity on the urbanization of “post-80s” and “post-90s” migrant workers.
Table 4. Results of the effect of self-identity on the urbanization of the old generation and the new generation migrant workers.
Table 5. Results of the regional endowment effect: The “I” identity estimation results of samples by regions.
Table 6. Results of the regional endowment effect: The “Me” identity estimation results of samples by regions.
Table 7. The family endowment effect: The “I” identity estimation results of samples by marriage.
Table 8. The family endowment effect: The “Me” identity estimation results of samples by marriage.
Table 9. The human capital effect: The “I” identity estimation results of samples by education.
Table 10. The human capital effect: The “Me” identity estimation results of samples by education.
Figure 4. Percentage of “post-90s” migrant workers’ urbanization out-of-bag error and the importance of variables.
Source: authors’ own estimations.