Figures & data
Table 1. Summary statistics.
Table 2. Pearson correlation coefficient.
Table 3. Unit root tests.
Figure 1. The trends of price returns. Sources: Litchi data are from the national litchi industry survey of the Modern Litchi and Longan Industrial Technology System of China. Apple data are from the agriculture product database of the Bric Global Agricultural Consulting Company.
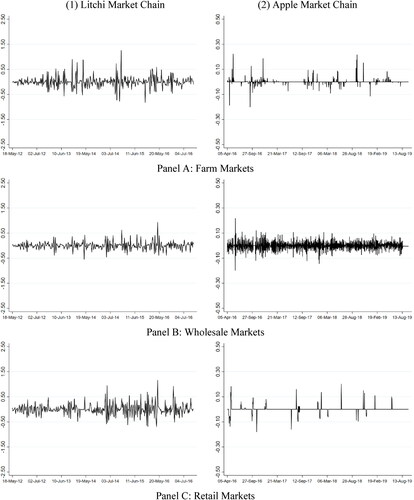
Table 4. CCC-MGARCH estimates.
Figure 2. DCC-MGARCH estimates. Sources: Litchi data are from the national litchi industry survey of the Modern Litchi and Longan Industrial Technology System of China. Apple data are from the agriculture product database of the Bric Global Agricultural Consulting Company.
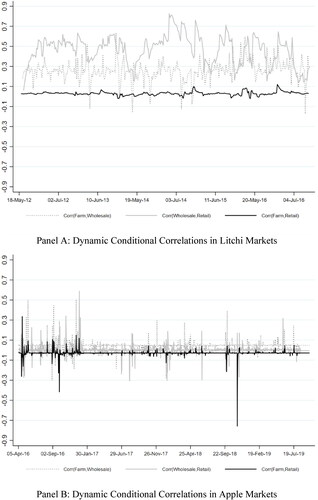
Table 5. BEKK-MGARCH estimates.
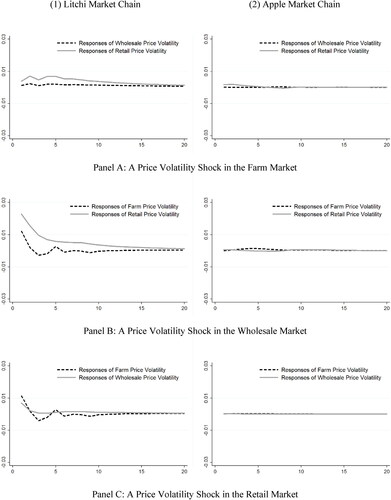
Figure 3. Volatility impulse response results. Notes: Each figure presents results for the response of price volatility in one market stage to a price volatility shock (one-standard deviation) in another market stage. The optimal lag length is determined by the AIC’s minimum value.
Sources: Litchi data are from the national litchi industry survey of the Modern Litchi and Longan Industrial Technology System of China. Apple data are from the agriculture product database of the Bric Global Agricultural Consulting Company.