Figures & data
Figure 1. Variables, time series.
Source: own elaboration.
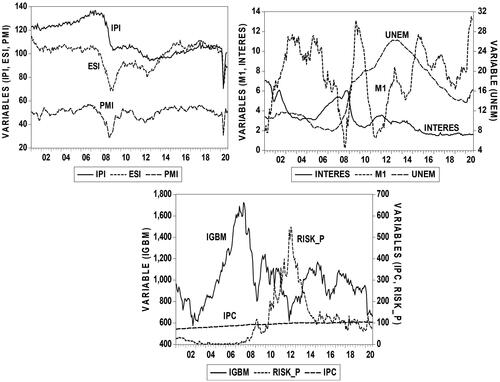
Table 1. Variables, statistical description.
Table 2. Unit root test, in levels and 1st difference.
Table 3. Regression model and residuals test.
Table 4. Lag selection VAR model (*Lag chosen by criterion, 5% level).
Figure 2. Inverse roots of the characteristic polynomial AR.
Source: own elaboration.
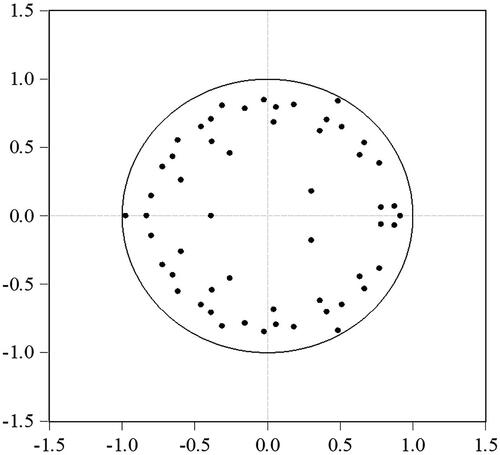
Table 5. Granger causality between variables (lags: 6).
Figure 3. Causality between macroeconomic variables and the stock market.
Source: own elaboration.
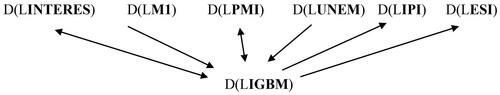
Figure 4. Causality between macroeconomic variables.
(Interest, Inflation, Monetary Aggregate M1)
Source: own elaboration.
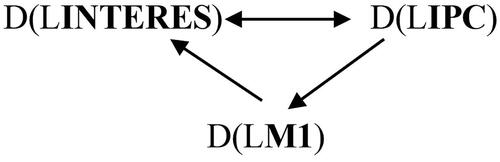
Figure 5. Causality between macroeconomic variables.
(Interest rate, Inflation, Activity indices, Monetary aggregate M1, Risk premium)
Source: own elaboration.
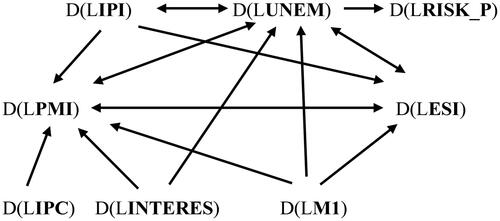
Figure 6. Impulse-response function (One S.D. Innovations ± 2 S.E.).
Stock market D(LIGBM) response to impacts the macroeconomic variables
Source: own elaboration.
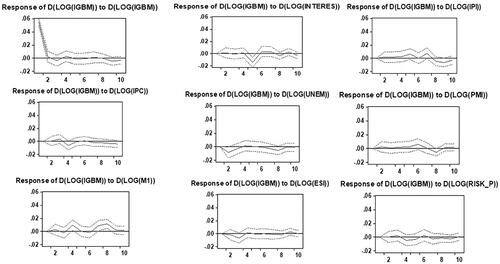
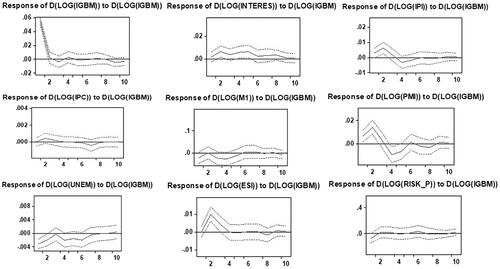
Figure 7. Impulse-response function (One S.D. Innovations ± 2 S.E.).
Macroeconomic variables response to impacts the stock market D(LIGBM)
Source: own elaboration.