
Figures & data
Table 1. The index system for new urbanization.
Table 2. Average comprehensive score and ranking of the quality of new urbanization in China.
Table 3. Description of the variables used in the model.
Table 4. Summary statistics of the variables.
Figure 1. Moran’s I trend of human capital and the new urbanization level.
Source: Author’s calculations.
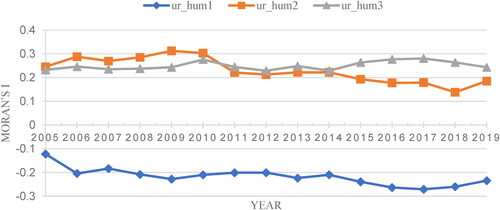
Table 5. LM test, LR test and Wald test for the two spatial weight matrices.
Table 6. SDM results based on random effect and fixed effect models.
Table 7. SDM regression results.
Table 8. Estimation results of the spillover effects.
Table 9. Heterogeneity test results.
Table 10. Robustness test results.