
Figures & data
Figure 1. Wind farm locations in Galicia. Source: Own elaboration. Data from (OEGA: Observatorio Eólico de Galicia, Citation2021).
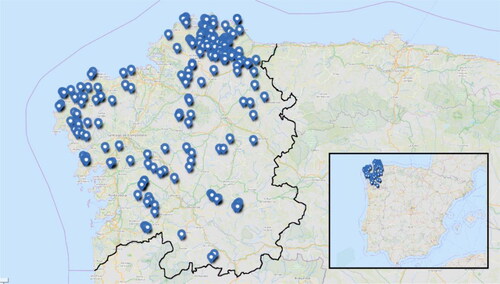
Figure 2. Average wind speed and protected natural areas in Galicia. Source: Own elaboration. Data from (IDAE, Citation2021).
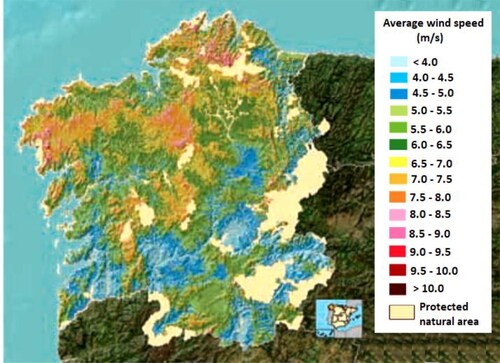
Table 1. Installed energy capacity in Spain and Galicia.
Table 4. Types of investments required.
Table 2. Balance sheet structure.
Table 5. Financial expenses at the beginning of the activity of the company.
Table 3. Structure of an income statement.
Table 6. Terms and conditions of external financing resources.
Table 7. Cost of the provisional operating accounts.