
Figures & data
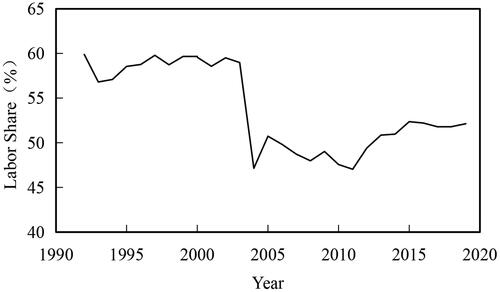
Graph 1. The trend of labour share in China.
Graph 2. Labour share in non-financial sectors.
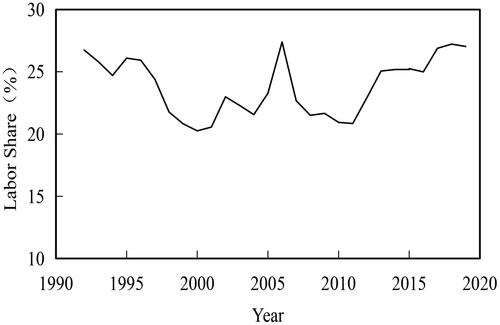
Table 1. Descriptive statistics.
Graph 3. Threshold parameter graph.
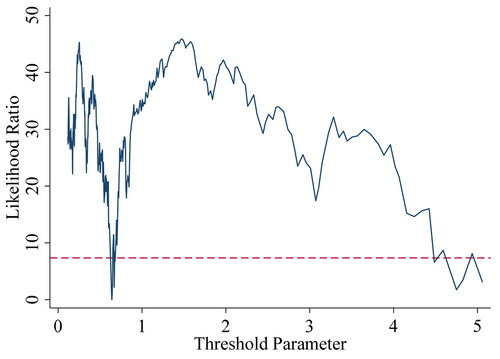
Table 2. Threshold tests (bootstrap = 300).
Table 3. Analysis of leverage and labour share of the firms.
Table 4. Robustness tests.
Table 5. Analyses for dividing samples and including the squared term of the independent variables.
Table 6. Heterogeneity analyses.
Table A1. Variable definition.
Table A2. Characteristics of cash flows in different enterprise life cycles.