
Figures & data
Figure 1. Individualism index and tax progressivity.
Note: The values of Tax Progressivity and Individualism Index are averaged over the sample period between 1990 and 2005 for each of the 87 countries whose data are utilised for the regression analyses below. Each country is notated according to ISO 3-letter code.
Source: generated by this study.
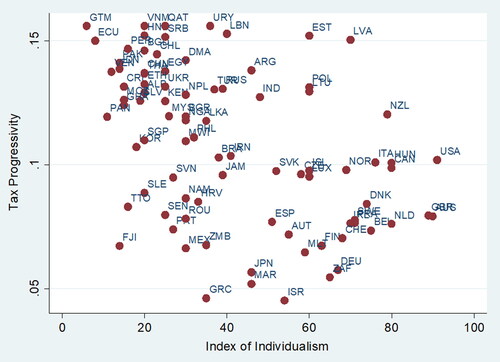
Figure 2. Pre-tax income inequality and tax progressivity.
Note: The values of Tax Progressivity and Individualism Index are averaged over the sample period between 1990 and 2005 for each of the 87 countries whose data are utilised for the regression analyses below. Each country is notated according to ISO 3-letter code.
Source: generated by this study.
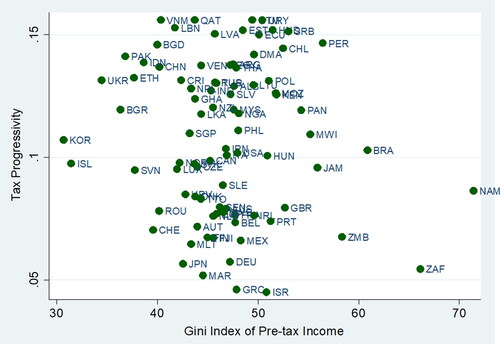
Table 1. Descriptive statistics.
Table 2. Effect of individualism on tax progressivity (random effect model).
Table 3. Effect of individualism on tax progressivity (population average model).