
Figures & data
Figure 1. China’s economic growth and investment efficiency (2002–2020).
Note: The data were obtained from the China Statistical Yearbook.
Source: Authors.
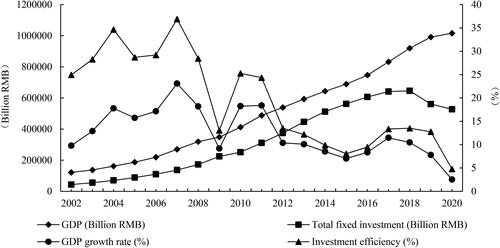
Table 1. Keywords related to the level of fintech.
Table 2. Descriptive statistics of variables.
Table 3. Baseline regression results.
Figure 2. The relationship between of fintech and investment efficiency: graphical analysis.
Note: Fintech and investment efficiency in the figure are the city means of the sample corporates.
Source: Authors.
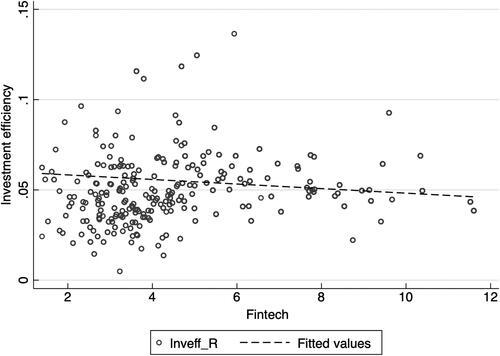
Table 4. Dynamic effects test.
Table 5. Heterogeneity analysis.
Table 6. Replacement investment efficiency, fintech and remove special samples.
Table 7. Instrumental variable method.
Table 8. Regression results of under-investment and over-investment.
Table 9. Fintech, financing constraints and corporate under-investment.
Table 10. Fintech, agency conflict, and corporate over-investment.