
Figures & data
Table 1. Variable definitions and descriptive statistics.
Table 2. Data sample range.
Figure 1. Scale of financial capital loss in sample counties of Shaanxi Province.
Source: authors’ own production.
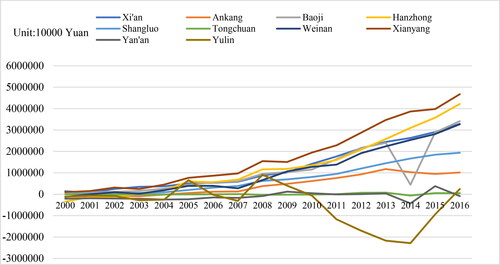
Figure 2. Scale of capital loss in three regions of Shaanxi Province.
Source: authors’ own production.
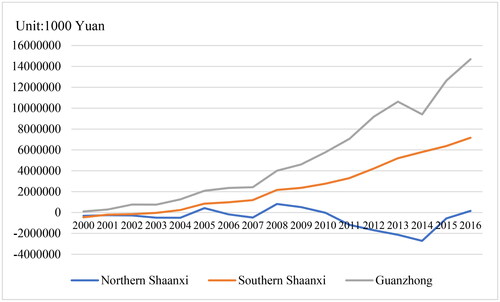
Figure 3. GDP per capita and capital outflow.
Source: authors’ own production.
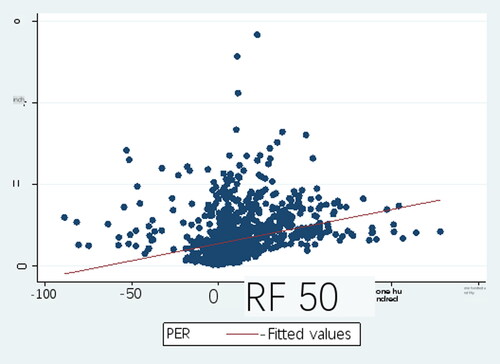
Figure 4. GDP per capita and the proportion of loans to GDP.
Source: authors’ own production.
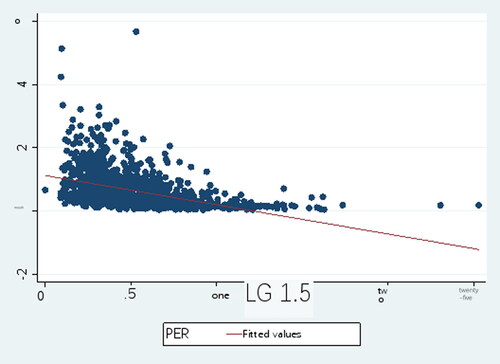
Figure 5. Per capita GDP and the proportion of primary industry.
Source: authors’ own production.
Figure 6. Per capita GDP and the proportion of fiscal expenditure to GDP.
Source: authors’ own production.
Table 3. Panel unit root test results.
Table 4. Cointegration test results.
Table 5. Baseline regression results.
Table 6. Model stability test.
Table 7. Empirical results of dynamic panel.