
Figures & data
Figure 1. International tourist arrival to four South Asian economies (1995–2019).
Source: World Bank (Citation2022)
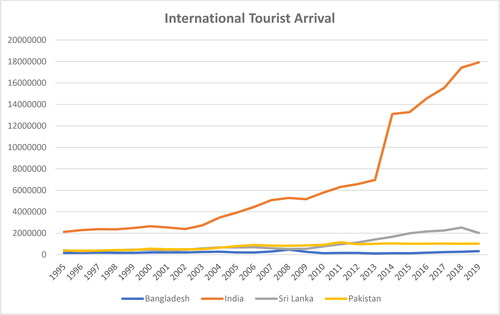
Figure 2. CO2 emissions from Four South Asian economies (1995–2019).
Source: World Bank (Citation2022)
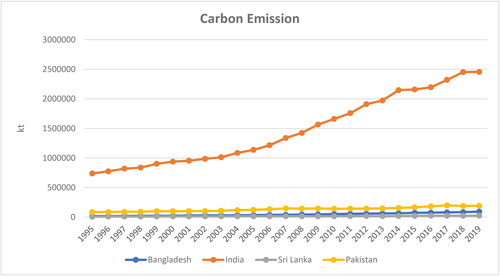
Figure 3. Theoretical representation of variables’ association.
Source: Authors own work based on the theoretical Framework.
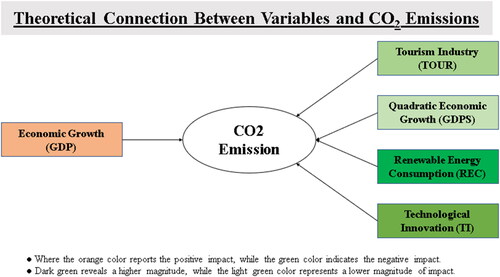
Table 1. Variables specification and data sources.
Table 2. Slope heterogeneity.
Table 3. Cross-section dependence.
Table 4. Unit root testing (Pesaran, Citation2007).
Table 5. Cointegration results (Westerlund, Citation2007).
Table 6. CS-ARDL.
Table 7. Robustness check using AMG.
Table 8. Dumitrescu-Hurlin panel causality.