Figures & data
Table 1. Descriptive statistics for MSCI equity index return series during the pre-COVID-19 phase.
Table 2. Descriptive statistics for MSCI equity index return series during the COVID-19 phase 1.
Table 3. Descriptive statistics for MSCI equity index return series during the COVID-19 phase 2.
Table 4. Mean and variance comparison test results.
Table 5. Comoment statistics for emerging Islamic equity index returns (in percent) during the pre-COVID-19 phase and COVID-19 phase 1 (source of contagion: China).
Table 6. Comoment statistics for emerging Islamic equity index returns (in percent) during the pre-COVID-19 phase and COVID-19 phase 2 (source of contagion: U.S.).
Table 7. Comoment statistics for emerging Islamic equity index returns (in percent) during the pre-COVID-19 phase and COVID-19 phase 2 (source of contagion: WORLD).
Table 8. Comoment tests of contagion during COVID-19 phase 1 ( = China).
Table 9. Comoment tests of contagion during the COVID-19 phase 2 ( = U.S.).
Table 10. Comoment tests of contagion during the COVID-19 phase 2 ( = WORLD).
Table 11. Data description of behavioural indicators.
Table 12. Summary statistics of FSI.
Table 13. Test results of GC and FDGC from the percentage change in FSI to MSCI emerging Islamic equity index returns.
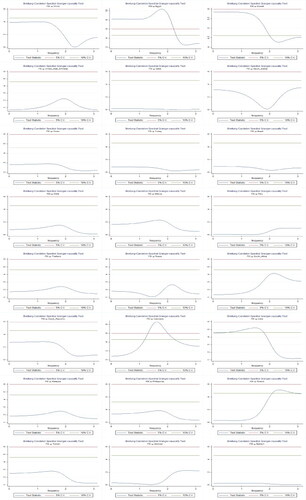
Figure A1. Breitung-Candelon Spectral Ganger causality test during the COVID-19 phase 1 ( China). Source: Authors’ calculations.
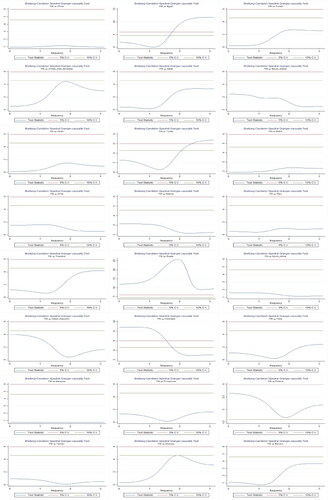
Figure A2. Breitung-Candelon Spectral Ganger causality test during the COVID-19 phase 2 ( U.S.). Source: Authors’ calculations.
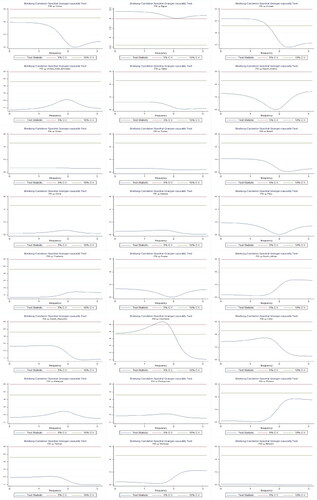
Figure A3. Breitung-Candelon Spectral Ganger causality test during the COVID-19 phase 2 ( WORLD). Source: Authors’ calculations.