
Figures & data
Figure 1. Trend analysis of the world economic freedom index. Source: author’s computation.
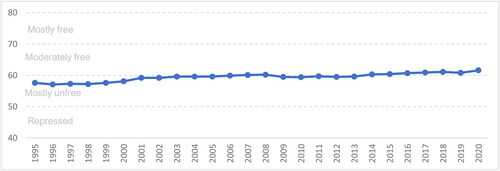
Figure 2. Trend analysis of the world economic freedom index according to regions. Source: author’s computation.
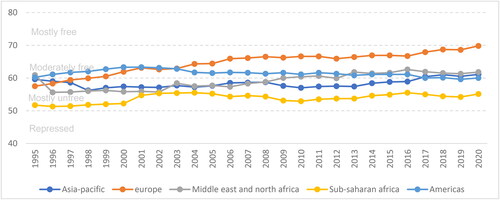
Table 1. Variable’s definition and descriptive statistics.
Table 2. Correlation coefficients.
Table 3. SYS–GMM estimator for the impact of economic reforms on trademark and patent innovation.
Table 4. Robustness: IV Quantile regression for the impact of economic reform on innovation.
Table 5. SYS–GMM estimates of the impact of economic reform on technological innovation (sub-sample).
Table 6. Mechanism: the SYS–GMM estimates of economic reforms on innovation through government effectiveness.
Table 7. Mechanism: the SYS–GMM estimates economic reforms on innovation through financial development.
Table 8. Mechanism: the SYS–GMM estimates of economic reforms on innovation through democracy.
Figure A1. Quantiles of patent applications. Source: Author’s computation.
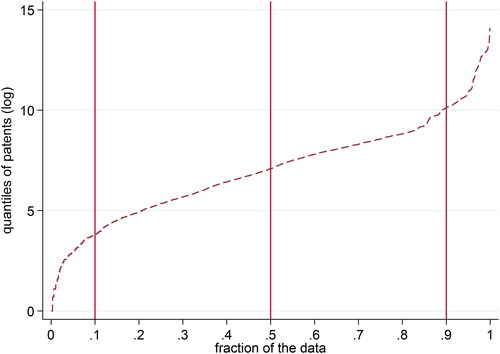
Figure A2. Quantiles of trademark applications. Source: Author’s computation.
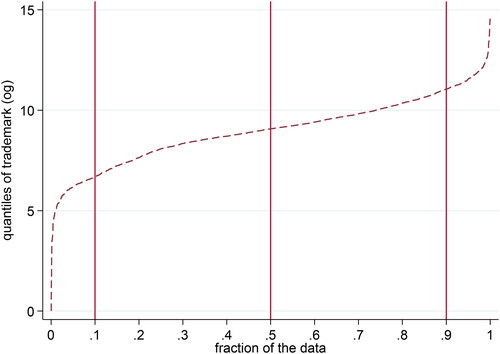
Figure A3. Distribution of trademark applications. Source: Author’s computation.
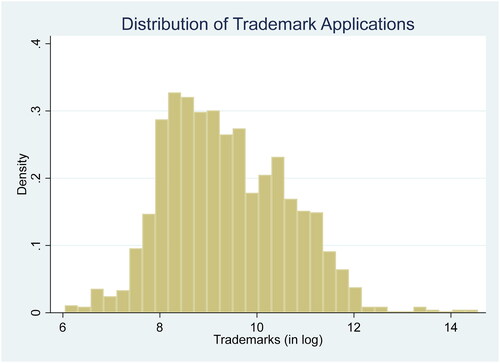
Figure A4. Distribution of patent applications. Source: Author’s computation.
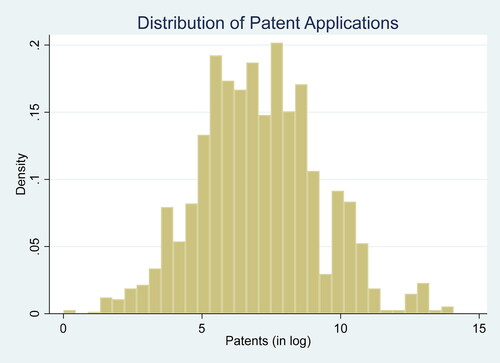
Table A1. List of countries.