
Figures & data
Figure 1. Gross enrollment ratio in tertiary education, 2014.
Source: Unesco publication (Citation2020).
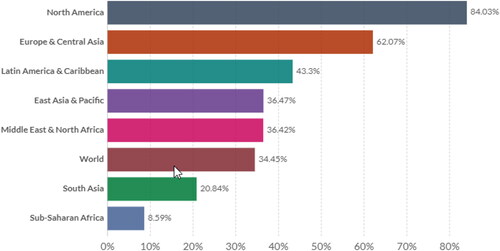
Figure 2. Worldwide school enrollment, tertiary (% gross) from 1970 to 2020.
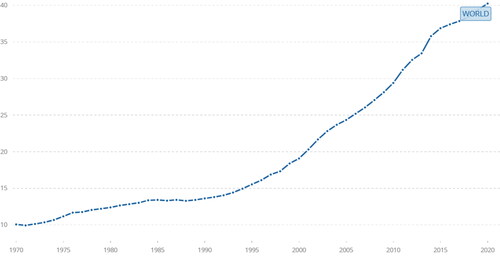
Figure 3. The framework of tertiary education and innovation generations and development.
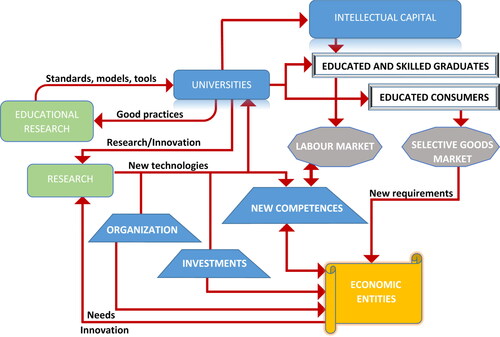
Table 1. Variables, sources, and descriptive statistics.
Table 2. Pesaran (Citation2015) test for cross-sectional dependence.
Table 3. Instrumental variable regression for the influence of national intellectual capital on technological innovation.
Table 4. 2SLS (Instrumental variable regression) for the influence of tertiary education on technological innovation and the role of national intellectual capital.
Table 5. Instrumental variable fixed effect regressions for the influence of tertiary education on technological innovation and the role of national intellectual capital.
Table 6. Robustness–Instrumental variable quantile regression for the impact of tertiary education on technological innovation (Patents).
Figure 4. Framework on how national intellectual capital reinforces the impact of tertiary education on innovation generations.
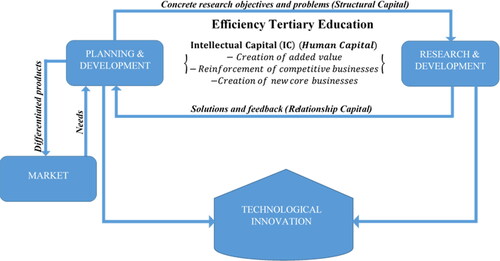
Figure A1. Quantiles of patent applications. Source: Author’s computations.
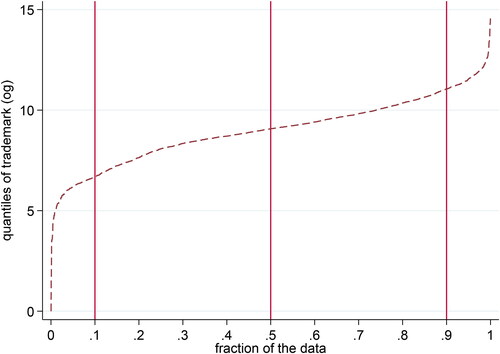
Figure A2. Quantiles of trademark applications. Source: Author’s computations.
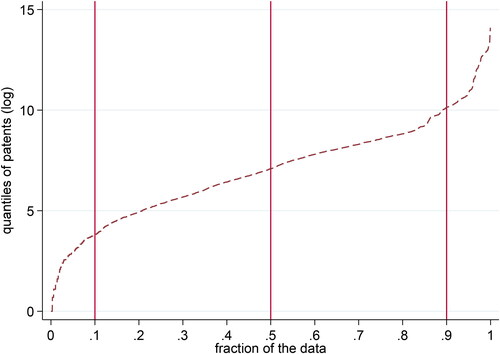
Table A1. Summary statistics.
Table A2. Correlation coefficient.
Table A3. List of countries.