
Figures & data
Figure 1. Mechanistic of digital economy on GTFP.
Source: Compiled by the author.
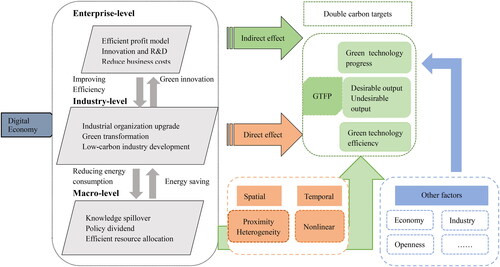
Figure 2. Emission scenarios for digital applications.
Data source: World Bank.
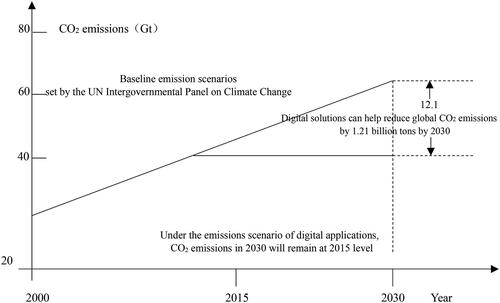
Figure 3. China’s digital economy (trillion yuan).
Source: China Academy of Information and Communications Technology.
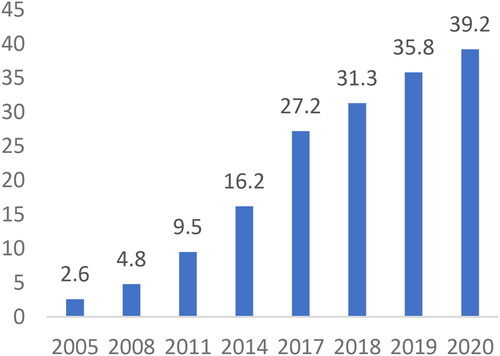
Figure 4. Digital economy and GDP growth rate.
Source: China Academy of Information and Communications Technology.
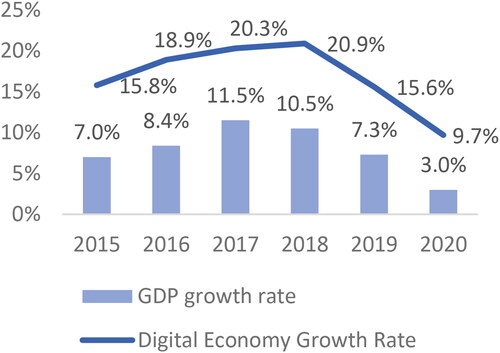
Figure 5. China’s digital economy as a share of GDP.
Data source: China Academy of Information and Communications.
Source: China Academy of Information and Communications Technology.
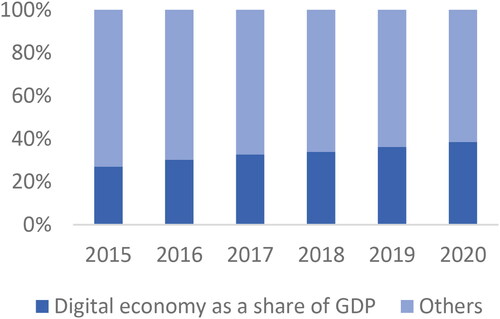
Figure 6. China’s digital economy penetration rate.
Source: China Academy of Information and Communications Technology.
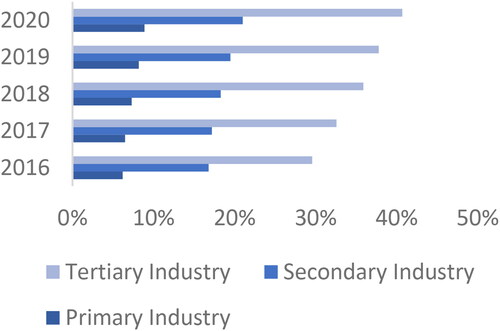
Figure 7. China’s industrial new and old dynamic energy trends.
Source: China Academy of Information and Communications Technology.
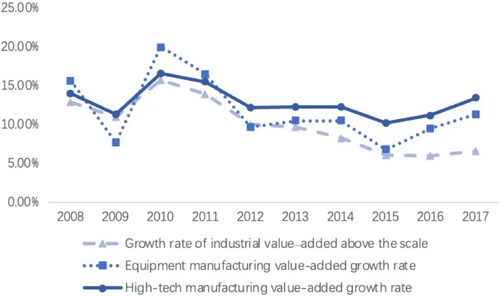
Figure 8. Production possibility frontier and distance function.
Source: Chambers et al. (Citation1996).
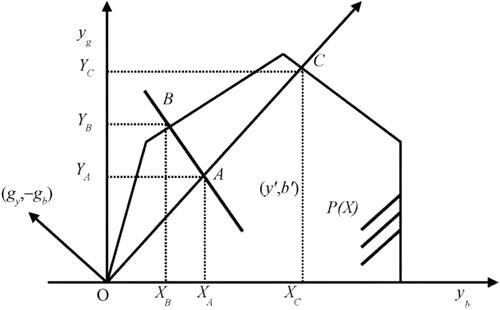
Table 1. Digital economy index.
Table 2. Full-Text variable description.
Figure 9. DEI Development trend.
Source: Calculated by the author.
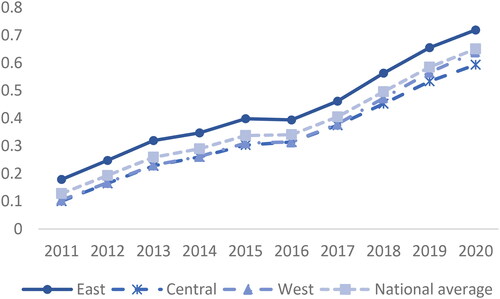
Figure 10. DEI in East.
Source: Calculated by the author.
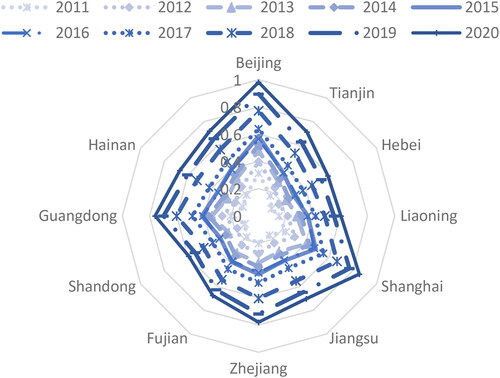
Figure 11. DEI in Central.
Source: Calculated by the author.
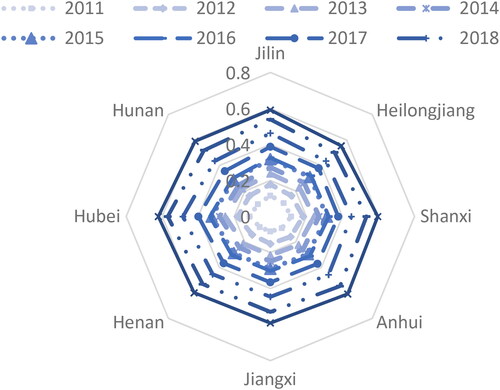
Figure 12. DEI in West.
Source: Calculated by the author.
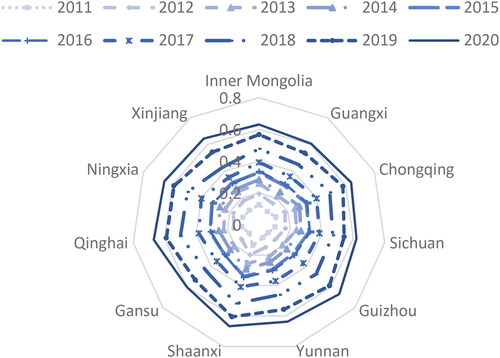
Table 3. Dagum Gini coefficient.
Figure 13. DEI Dagum Gini coefficient.
Source: Calculated by the author.
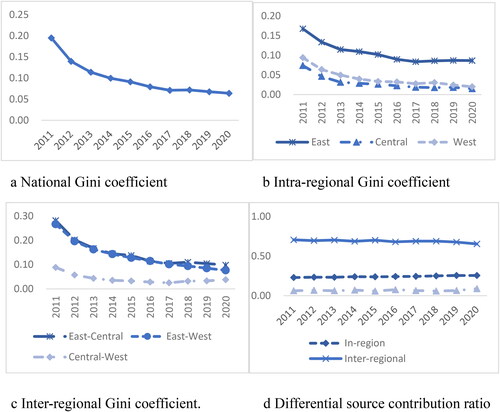
Table 4. Input-Output variables.
Figure 14. Dynamics of industrial GTFP.
Source: Calculated by the author.
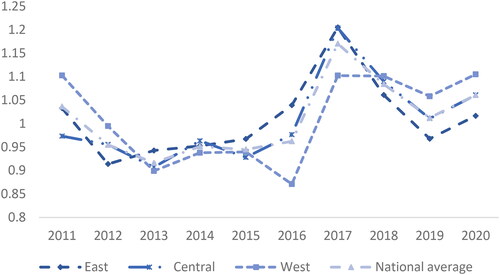
Table 5. Baseline regression results.
Table 6. Regional heterogeneity analysis.
Table 7. Robustness and endogeneity test.
Table 8. Threshold effect test.
Figure 15. Estimated values and confidence intervals.
Source: Calculated by the author.
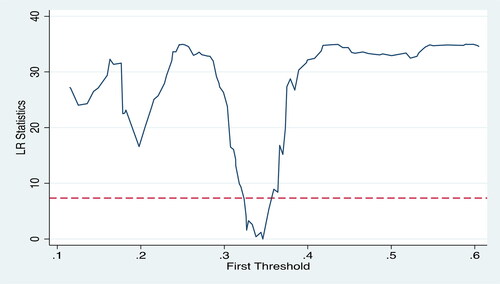
Table 9. Estimated threshold values.
Table 10. Model estimation results.
Data availability statement
The data that support the findings of this study are available on request from the corresponding author.