
Figures & data
Table 1. Descriptive statistics.
Figure 1. The change in final energy consumption, revenues from environmnetal tax and greenhouse gas emissions in old EU countries (index 1995 = 100). Source. Authors calculation based on data from Eurostat (Citation2023).
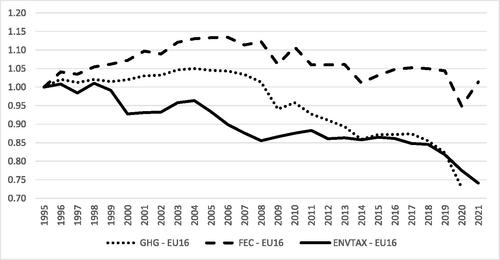
Figure 2. The change in final energy consumption, revenues from environmental tax and greenhouse gas emissions in new EU countries (index 1995 = 100). Source. Authors calculation based on data from Eurostat (Citation2023).
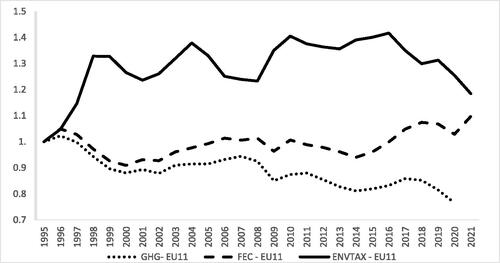
Table 2. Results of cross-sectional and unit-root tests.
Table 3. Panel cointegration test results.
Table 4. Estimation results of the dynamic panel model.