
Figures & data
Table 1. HiFi library preparation protocols used in this study.
Figure 1. Total length, N50 value, and number of HiFi reads obtained from DNA libraries prepared using six different protocols. The different symbols (square, circle, triangle, plus, cross, and diamond) indicate the different protocols (1, 2, 3, 4, 5, and 6, respectively; detailed in table 1), and different colors (red, blue, gray, and black) indicate the different tree species (Larix kaempferi, Chamaecyparis obtusa, Cryptomeria japonica, and Cunninghamia lanceolata, respectively).
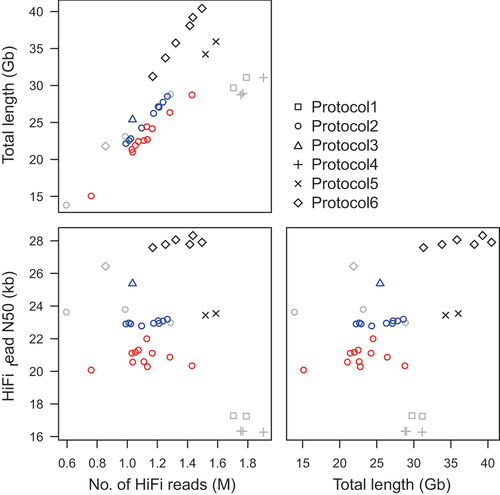
Figure 2. Estimation of the genome sizes of L. kaempferi, C. obtusa, C. japonica, and C. lanceolata by k-mer distribution analysis. The k-mer size of 21 was used for the four species.
Table 2. Genome assembly statistics of four timber tree species.