Figures & data
Table 1. Germination (G), Vigour Classification (VC), Proline, Root length (RL), Shoot length (SL), Total length (TL), Root dry mass (RDM), shoot dry mass (SDM), total dry mass (TDM), electrical conductivity (CE) and moisture content (MC) from the initial evaluation of bean seed from the cultivars IPR-139, Pérola and IPR-Tiziu.
Figure 1. Moisture content (A), electrical conductivity of imbibition water (B) and ethanol determination in imbibition water (C) of three bean cultivars seeds submitted to different submersion period. (B) Adjusted equations: y (IPR-139) = R² = .8877**; y (Pérola) =
R² = .8937**; y (IPR-Tiziu) =
R² = .9201**. Significant equation: *(p < .05); **(p < .01). In the same period of submersion equal letters are not statistically different by the Tukey’s test at .05 of probability; the absence of a letter indicates no significance. (C) Error bars are the standard deviation.
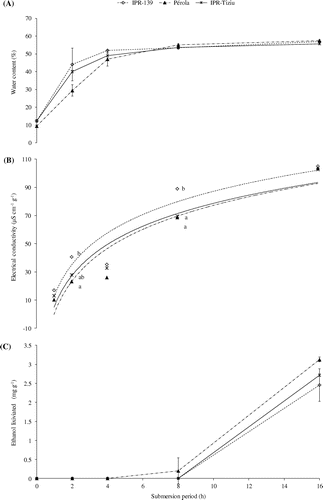
Table 2. Germination and vigour classification of three bean cultivars seeds subjected to different submersion time periods.
Table 3. Root, shoot and total length of bean seedling from three cultivars subjected to different submersion time periods.
Table 4. Root, shoot and total dry mass of three bean cultivars seedlings subjected to different submersion time periods.
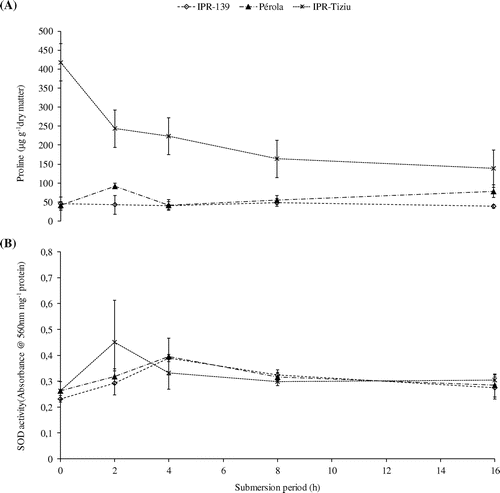
Figure 2. Proline content (A) and SOD activity (B) of three bean cultivars subjected to different submersion period. Error bars are the standard deviation of three repetitions by cultivar and submersion period.