Figures & data
Figure 1. Monthly average temperature and total rainfall during the period of 2009, 2010, 2011 and 30 year average E, M and L indicate early, middle and late in each month, respectively.
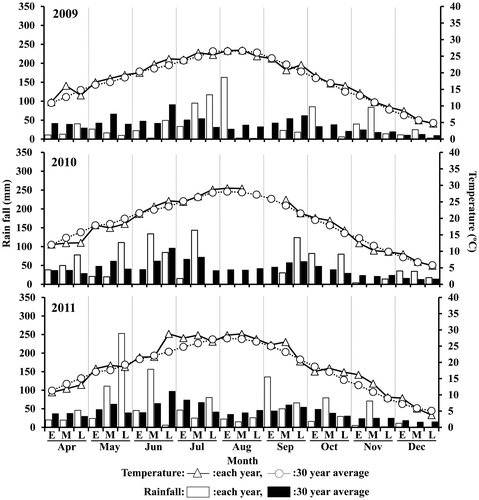
Table 1. Cropping patterns tested and the data of sowing and harvesting in each year.![]()
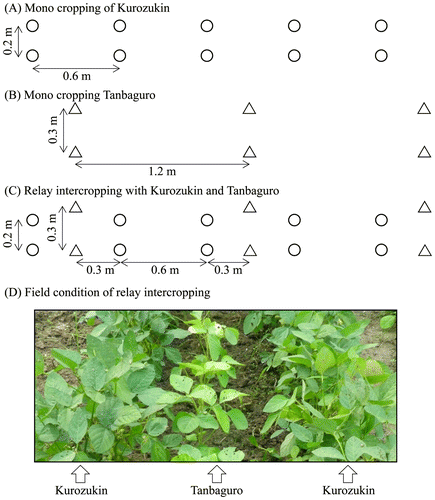
Figure 2. Row arrangement of Kurozukin, Tanbaguro and their relay intercropping. The symbols of ○ and △ represent Kurozukin and Tanbaguro, respectively. (A) Mono cropping of Kurozukin, (B) Mono cropping of Tanbaguro. (C) Relay intercropping with Kurozukin and Tanbaguro. In relay intercropping fields, Tanbaguro was sown between the rows of Kurozukin, leading to the row arrangement as shown by (C). (D) A photograph of the field condition of relay intercropping. The photograph was taken on 20 July of 2011 (just before the harvest of Kurozukin).