Figures & data
Figure 1. Field showing (a) Toumitsu, Big sugar, Kanmi, DH, TDN, (b) Supersugar, Bromo, Wray and Roma, (c) relative height of the tallest variety Toumitsu (450 cm) grown in 2016 and (d) Mini sorghum and Meter sorghum grown in 2015.
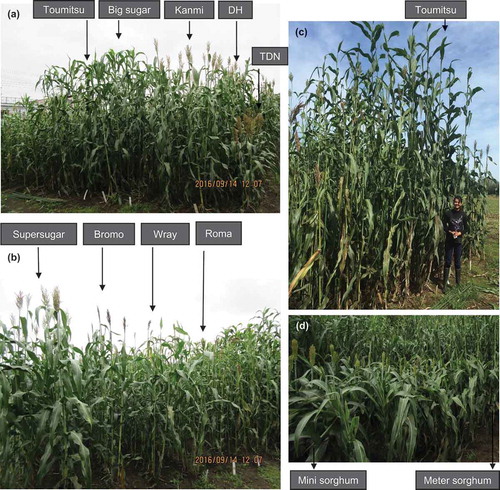
Table 1. Primers used for real-time PCR.
Figure 2. (a) NSC content in the lowermost internodes of sorghum stems and (b) pattern of sugar accumulation expressed in terms of brix for each internode along the whole length of the stem, for varieties grown in 2016. Data represent the mean ± SE (n=3–4). Varieties sorted on the basis of increasing sucrose content. The colour legend is not numerically universally applicable, but indicative of the high-to-low pattern of brix for each variety.
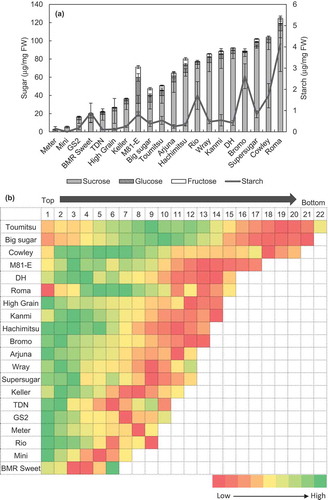
Table 2. Correlation between morphological characteristics and sucrose and total sugar content for varieties cultivated in 2015 and 2016. Pearson’s correlation coefficient is represented as r. Asterisks indicate statistical significance of correlation with *p < 0.05 and **p < 0.01 (n.s. – not significant).
Figure 3. Differences in total soluble sugar content (shown as lines) and total sucrose content (shown as bars) in the lowermost internodes of sorghum stems for nine varieties between 2015 (black bars and dotted line) and 2016 (grey bars and solid line). Data represent the mean ± SE (n=3–4). Asterisks indicate statistical significance of difference between the years using Student’s T statistic with *p<0.05, **p<0.01 and ***p<0.001.
Figure 4. (a) Correlation of brix with sucrose content, (b) varieties sorted in terms of juiciness of the stems, (c) correlation of juiciness with brix and (d) the maximum theoretical ethanol yield. Data represent the mean ± SE (n=4–6) for varieties grown in 2016. r represents the Pearson’s coefficient of correlation and asterisks indicate the statistical significance of this correlation with **p<0.01.
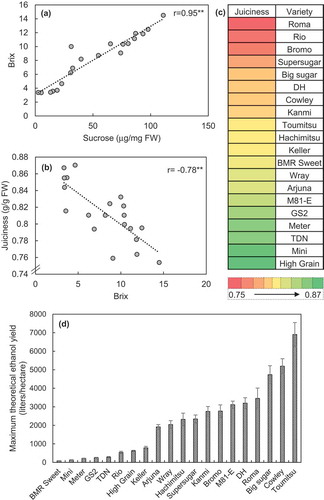
Figure 5. mRNA abundance of (a) SbINV1 and (b) SbINV2, expressed as %EF1a, and the corresponding sucrose content in their lowermost internodes. Expression levels are shown by bars and sucrose content by lines. Correlation of sucrose content with (c) SbINV1 and (d) SbINV2 for high sugar-yielding varieties is shown. Data represent the mean ± SE (n=3–4). r indicates the Pearson’s coefficient of correlation. Asterisks indicate statistical significance with ***p<0.001. Varieties sorted on the basis of increasing sucrose content. Data shown for 2016 with similar correlation data obtained in 2015.