Figures & data
Table 1. General information of on-farm experiments of non-puddled aman and boro season rice.
Figure 1. Map of Bangladesh showing the locations of on-farm studies of non-puddled rice.
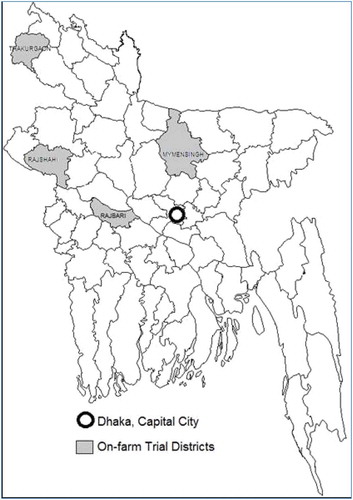
Figure 2. Monthly total rainfall (mm), average maximum and minimum temperature (°C) in study locations (called upazilas, districts). Data were collected from nearest weather stations of the Metrological Department of Bangladesh (BBS, 2016).
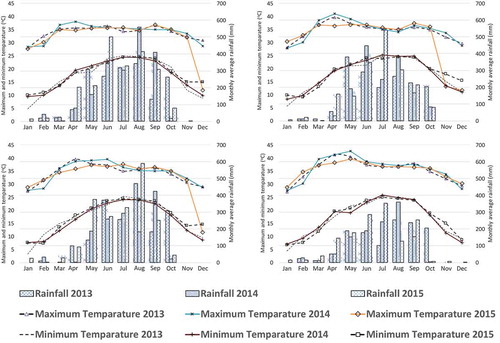
Table 2. Labour uses and cost for labour (hired and family) on non-puddled transplanting (NT) vs. puddled transplanting (PT) for on-farm aman rice cultivation in Bangladesh.
Table 3. Tillage and labour cost for on-farm experiments with non-puddled transplanting (NT) vs. puddled transplanting (PT) on boro rice.
Table 4. Yield attributing characters of on-farm experiments of aman season rice.
Table 5. Yield attributing characters of on-farm experiments of boro season rice.
Table 6. Grain mass, grain and straw yield of on-farm experiments with aman season rice.
Table 7. Grain and straw yield of on-farm experiments with boro season rice.
Table 8. Economics for on farm experiments of aman season rice.
Table 9. Economics for on farm experiments of boro season rice.
Table 10. Cost of actual different inputs and outputs (US$ ha−1).
Figure 3. Number of tillage passes and cost of tillage and levelling for land preparation in aman (upper) and boro (lower) season rice cultivation at different locations in Bangladesh.
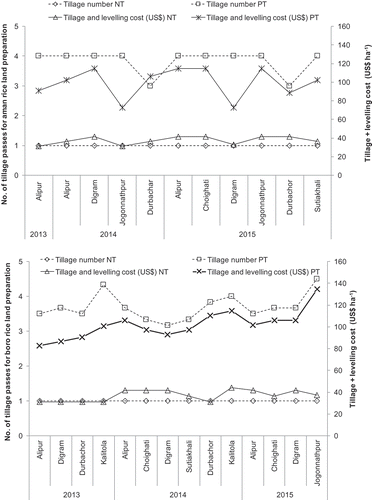
Figure 4. Source of labour for aman (upper) and boro (lower) season rice cultivation. Dots and diagonal bricks in the bars represent the family and hired labour (person-days ha−1), respectively. NT = Non-puddled transplanting of rice seedling; PT = Conventionally puddled transplanting of rice seedling; AliPr = Alipur, DiGrm = Digram, JgnthPr = Jogonnathpur, DbrChr = Durbachor, ChoGti = Choighati, KliTla = Kalitola, SutKli = Sutiakhali.
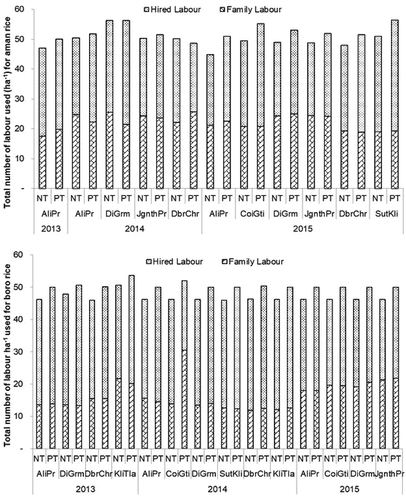
Figure 5. Relationship between grain yield for non-puddled transplanting (NT) and puddled transplanting (PT) of rice with [A] number of effective tillers and [B] thousand grain mass for 2015 boro rice.
![Figure 5. Relationship between grain yield for non-puddled transplanting (NT) and puddled transplanting (PT) of rice with [A] number of effective tillers and [B] thousand grain mass for 2015 boro rice.](/cms/asset/c9350c76-10c1-4753-a829-a2424fa90d10/tpps_a_1564335_f0005_oc.jpg)
Figure 6. Ranking of individual farmers’ rice grain yield (t ha−1) (aman rice [A] and boro rice [C]) and net return (aman rice [B] and boro rice [D]). Sites are ordered by net returns from low (left) to high (right) for NT [blue line with closed circles] for 2013, 2014 and 2015. Paired PT crops are shown underneath for each site by orange-coloured bars.
![Figure 6. Ranking of individual farmers’ rice grain yield (t ha−1) (aman rice [A] and boro rice [C]) and net return (aman rice [B] and boro rice [D]). Sites are ordered by net returns from low (left) to high (right) for NT [blue line with closed circles] for 2013, 2014 and 2015. Paired PT crops are shown underneath for each site by orange-coloured bars.](/cms/asset/d184617e-1f21-4ede-91ec-489e8f4d282a/tpps_a_1564335_f0006_oc.jpg)
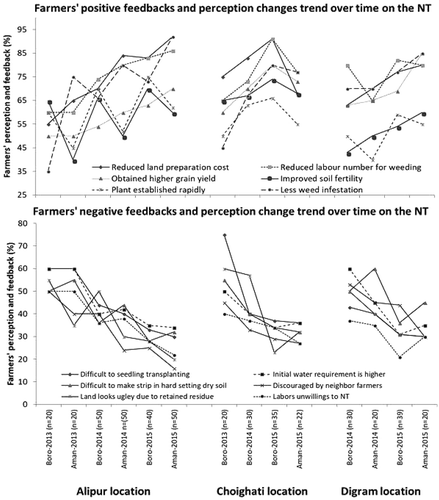
Figure 7. Percentage of farmers’ with positive or negative perceptions about aspects of non-puddled transplanting (NT) from focus group discussions in three locations after each of six seasons. The percentage values are for the whole group in each location and season.