Figures & data
Figure 1. Air temperature, precipitation, and duration of sunshine during the growth periods. For air temperature (left box), solid lines and dashed lines represent maximum and minimum air temperatures averaged for every 30 days after planting. For precipitation (central box) and duration of sunshine (right box), data are the cumulative values for every 30 days after planting.
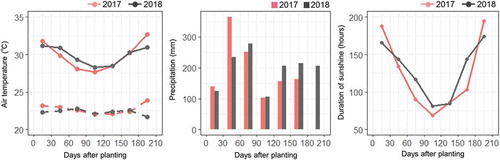
Figure 2. Days to sprouting (a), tuber yield (b), and tuber multiplication rate (c) of the different sett sizes. Data are average ± standard errors for 15 plants. Bars with different letters represent significant differences at the p < 0.05 level.
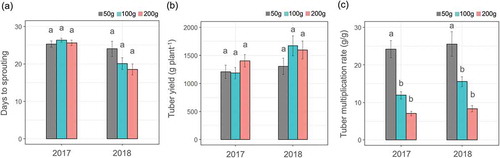
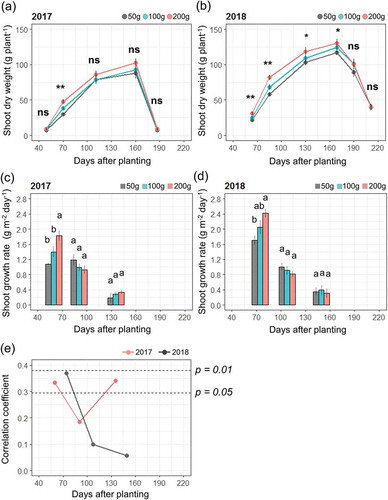
Figure 3. Time-course changes in shoot dry weight (a, b), shoot growth rate (c, d), and correlation coefficient between shoot growth rate and tuber yield (e). Shoot dry weight was estimated by a non-destructive method (Iseki & Matsumoto, Citation2019). Data are average ± standard errors for 15 plants. *, **, and ns represent significant differences at p < 0.05, p < 0.01 level, and not significant, respectively. Bars with different letters represent significant differences at p < 0.05.