Figures & data
Figure 1. Cowpea plant structure. Photograph of a TVu2723 plant at pod harvest. A plant with a representative shape was cut into three parts, which are shown in each photograph. (a) upper, (b) middle, and (c) basal parts of a cowpea plant. The numbers indicate the node positions of the primary branch or peduncle. Arrows and stars represent the peduncles and secondary branches, respectively.
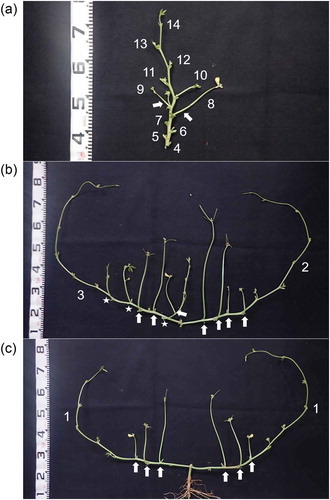
Figure 2. Description of positional variables. (a) Peduncle position on a plant. Numbers in bold, circles, and parentheses represent the node positions on the main stem, primary branch, and secondary branch, respectively. Examples of the description of the peduncle position with positional variables are shown in . (b) Seed position in a pod. Numbers were allocated from the proximal part of the pod, including the empty seed space.
Table 1. Abbreviations of positional and position-related variables used for the ABN analysis.
Figure 3. Log marginal likelihood values compared among ABN models with different maximum allowable numbers of parents per variable. For each accession, models were tested if their maximum number of parents ranged from 1–6.
Figure 4. Total seed number and seed yield in each of the 10 plants. The red and blue dashed lines in each box represent the mean and median for the 10 plants, respectively.
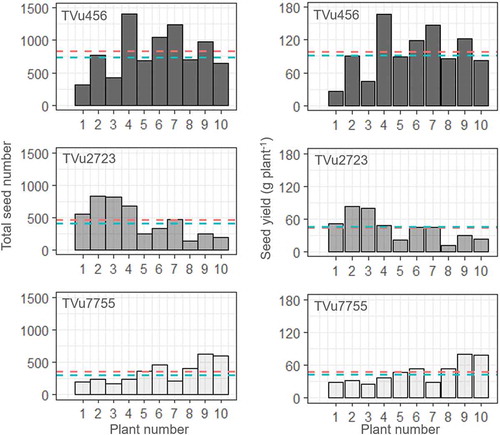
Figure 5. Seed distributions in the positional and position-related variables. Abbreviations for the variables are shown in . The red and blue dashed lines in each box represent the mean and median, respectively.
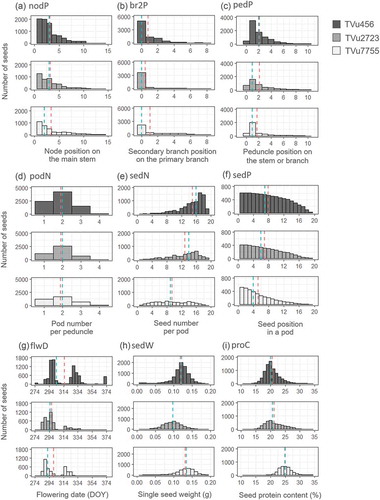
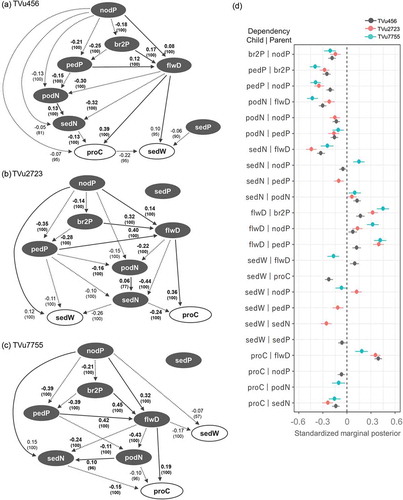
Figure 6. Directed acyclic graph (DAG) and forest plot of 95% intervals of marginal posterior in each accession. (a, b, and c) The DAG of the final model, describing intra-plant variations in single seed weight and protein content, are separately shown for each accession. Arcs are labeled with standardized marginal posterior medians which indicate effect size. The numbers in parenthesis represent the repeatability with percentages obtained from 10,000 bootstrapping, which indicates the reliability of the dependency. Solid and dotted arcs represent positive and negative relationships between variables, respectively. Arcs with bolded numbers represent dependencies common to all three accessions. Seed weight and protein content are represented by open circles. The other positional and position-related variables are indicated with filled circles. (d) The 95% intervals of standardized marginal posterior (the effect size indicator) of all dependencies are shown in the forest plot.